

Step outside your home. The water flowing from your tap, the tolls collected on the highway, the gas that heats your stove, and the power delivered to your city. None of it runs on a web app or a mobile dashboard. It runs on something many people have never heard of: operational technology.
We live in a world saturated with technology, yet most of us interact with only a thin slice of it: websites, mobile applications, cloud services. These fall under information technology (IT) – systems that process, store, and communicate data.
But there is an entirely different category of technology silently running the physical world around us, and that is operational technology (OT), and not to be confused with OpenTelemetry(OTel).
What is operational technology?
Operational technology refers to hardware and software that monitor and control physical devices, processes, and events in the real world, typically industrial equipment and systems.
Unlike IT systems, OT is not something most engineers are taught to think about, and it is rarely in the spotlight. Yet it underpins virtually every critical service in modern society.
Some of the most common OT environments include:
- Water treatment and pumping stations
- Tolling and traffic management systems
- Gas pipelines and distribution networks
- Electrical grid and energy providers
- Mining and heavy industry machinery
- Manufacturing and process automation
When OT systems work, we never notice them. When they fail, the consequences can be immediate, physical, and severe.
The criticality of operational technology
The stakes for OT systems are often fundamentally different from those of a slow-loading webpage or a failing microservice. IT outages can certainly be severe. A payments platform going down or a trading system freezing carries real consequences. But a failing OT system can translate directly into public safety crises, environmental damage, or disruption to essential services.
- Water treatment: A malfunction in the dosing controls could cause incorrect levels of chlorine or other chemicals to enter the supply, with potentially life-threatening consequences for entire communities.
- Mining: OT systems monitor underground ventilation, gas concentrations, and haul fleet operations. A failure in gas detection or ventilation control can put workers in immediate physical danger, while tailings dam monitoring failures carry catastrophic environmental and community risk.
- Energy distribution: OT manages load balancing and fault isolation, and a monitoring blind spot here can cascade into widespread outages affecting hospitals, transport networks, and homes.
The common thread across all of these is this: OT systems must simply work.
Unlike IT applications, there is no graceful degradation, no “try again later.” Reliability is not a feature; it is the baseline expectation, and anything below it has real-world consequences.
Understanding SCADA: The nervous system of OT
Behind most OT environments sits a SCADA system. SCADA stands for Supervisory Control and Data Acquisition. It is the software and hardware framework that collects real-time data from sensors and field devices, relays it to operators, and sends commands to physical equipment.
Think of SCADA as the nervous system of an OT environment. Sensors are the nerve endings, PLCs (Programmable Logic Controllers) are the spinal cord, and the SCADA server is the brain, making sense of thousands of data points simultaneously.
A typical SCADA architecture spans four levels:
- Field level: sensors and actuators collecting physical world data.
- Control level: Remote Terminal Units (RTUs) and Programmable Logic Controllers (PLCs) processing and responding to signals.
- Supervisory level: the SCADA server aggregating data and surfacing it to operators.
- Enterprise level: reporting, historian databases, and integration with IT systems.
This layered architecture maps closely to the Purdue Enterprise Reference Architecture (PERA), the industry-standard framework for IT/OT network segmentation, widely referenced in IEC 62443 and ISA-95 standards. While originally designed for security, PERA has become the de facto reference model for IT/OT convergence, monitoring, and observability across industrial sectors.
SCADA systems have existed for decades. They were built for reliability in isolated, purpose-specific environments, where stability mattered more than broad visibility. As those environments become more connected to enterprise systems, the old model creates a new challenge: teams need observability across systems that were never designed to expose their data that way. Traditionally, monitoring SCADA using IT technologies has been difficult, creating significant visibility gaps in environments where visibility matters most.
The value of SCADA observability for OT teams
Traditionally, OT and IT have lived in separate worlds. Network isolation, proprietary protocols, and purpose-built hardware made it difficult, often impossible, to apply conventional monitoring tools to SCADA environments. Operators relied on siloed dashboards, manual checks, and tribal knowledge. Fortunately, that’s changing.
For teams operating critical infrastructure, SCADA observability can change the operating model from reactive troubleshooting to proactive risk reduction. Instead of discovering issues only after field engineers report symptoms, operators can monitor leading indicators such as database contention, sync delays, connection health, and host resource pressure before they affect service delivery.
The value is not simply collecting more telemetry; it is correlating OT signals with the surrounding IT systems that increasingly support industrial operations. When host-level metrics, SCADA-specific KPIs, and enterprise-system behavior can be viewed together, teams can gain a more complete picture of system health than isolated consoles or historian tools can provide.
This is especially important as OT environments become more connected across Purdue layers. A spike in database lock usage or synchronization time may reflect conditions that began elsewhere, such as a burst of field-sensor anomalies, degraded network performance, or a stressed enterprise integration. Observability helps teams trace those relationships across layers instead of treating each signal as an isolated event.
Monitoring SCADA with Dynatrace Grail
Using the Dynatrace Grail unified data lakehouse it is now possible to ingest log data directly from SCADA systems and apply the same observability discipline that modern IT teams use on their cloud workloads.
By streaming logs from SCADA machines into Grail, teams gain capabilities that were simply not possible with traditional OT monitoring approaches:
- Real-time visibility: live metrics on database health, lock usage, sync times, and connection state, all from a unified view.
- Historical analysis: long-term trend analysis across KPIs to help detect slow degradation before it becomes a service-affecting failure.
- Proactive alerting: threshold-based and anomaly-driven alerts that can notify operators before a performance issue becomes a crisis.
- Unified observability: IT and OT data correlated in the same platform, closing the historical divide between the two disciplines.
In practice: Monitoring Schneider Electric GeoSCADA Expert with Dynatrace
To make this concrete, consider the dashboard built for monitoring Schneider Electric’s GeoSCADA Expert database, a widely deployed SCADA platform used in utilities, infrastructure, and industrial environments. By ingesting its logs into Dynatrace, we built a comprehensive, real-time view of database performance for a customer.
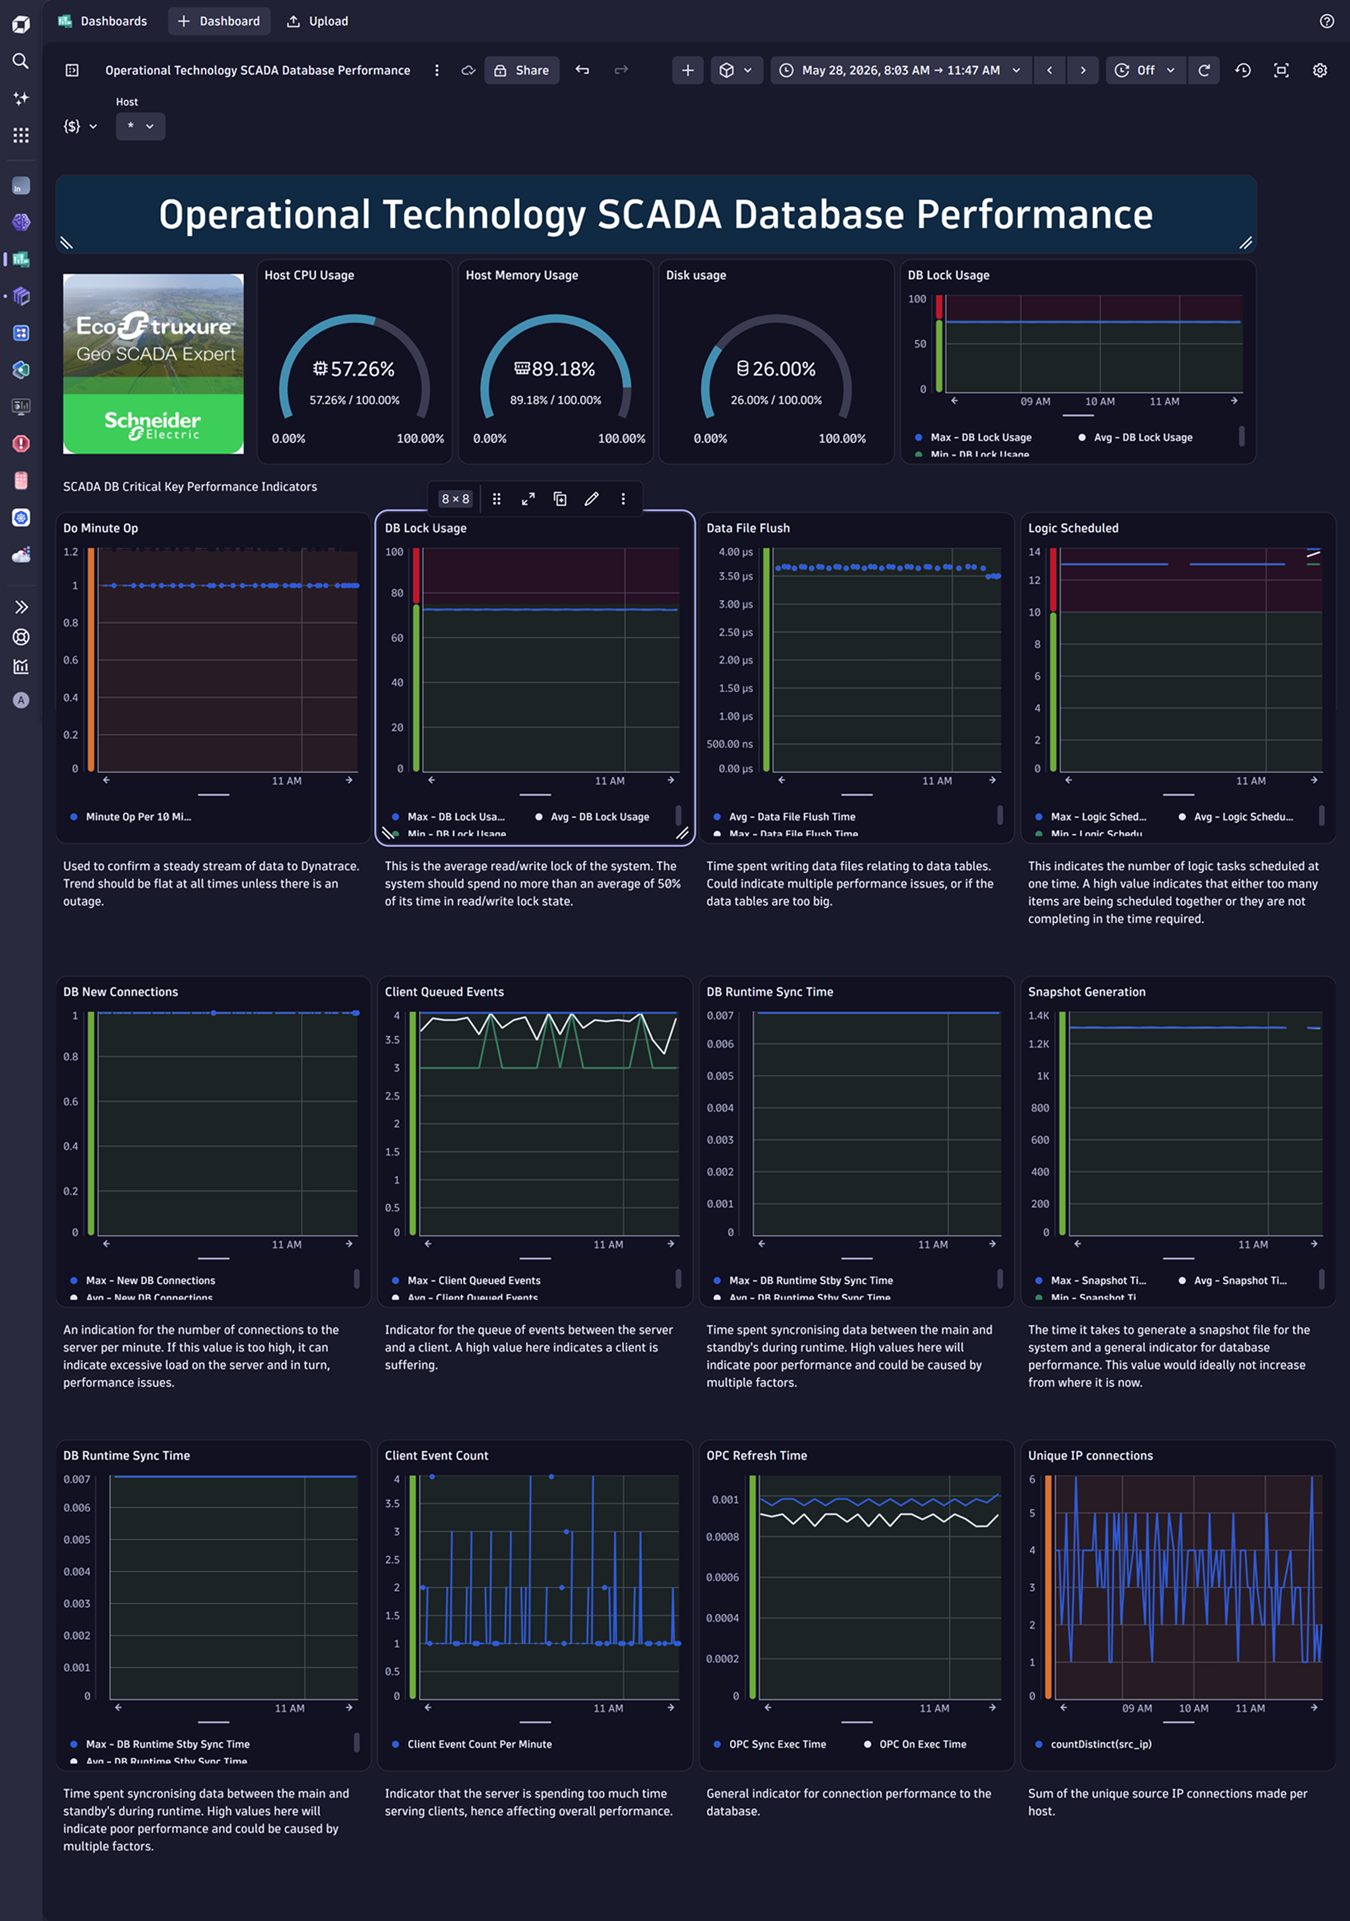
The dashboard surfaces both host-level metrics and database-specific KPIs side by side. At a glance, operators can see the host CPU running at 53 percent, host memory at 87 percent (a high watermark worth watching), and disk usage at a healthy 25 percent. But the real value lies in the SCADA-specific indicators.
Key KPIs and what they mean
- Do Minute Op: A flat, steady stream confirms that data is continuously flowing into Dynatrace. Any gap in this metric signals a potential outage or data ingestion problem, so it should be flat at all times.
- DB Lock Usage: This is the average read/write lock usage of the system. It should spend no more than an average of 50 percent of its time in read/write lock state. Spikes visible in the dashboard show moments of peak contention.
- Data File Flush: Time spent writing data files relating to data tables. Performance issues here, or consistently high values, indicate that the data tables may be oversized.
- Logic Scheduled: Indicates the number of logic tasks scheduled at one time. A high value suggests either too many items are being scheduled together, or they are not completing within the required time.
- DB Runtime Sync Time: Time spent synchronizing data between the main and standby databases during runtime. High values indicate poor performance and could be caused by multiple factors including network latency or database load.
- Client Queued Events: An indicator for the queue of events between server and client. A high value indicates a client is suffering, as the server cannot keep pace with demand.
- Snapshot Generation: The time it takes to generate a snapshot file for the system. Ideally, this value should not increase over time. A rising trend here means the database is doing progressively more work to capture its state.
- Transaction Execute Time: A general indicator for connection performance to the database, showing how quickly GeoSCADA transaction handlers process incoming data updates and serve them to clients. What makes this particularly valuable is the combination of raw telemetry with descriptive operational context.
Each panel is accompanied by plain language guidance on what the value means and when to act, bridging the gap between raw data and operational decision-making in a way that traditional SCADA historian tools rarely achieve.
Closing the visibility gap in SCADA environments
Operational technology observability is still an emerging discipline. The vast majority of SCADA environments today are running without the kind of real-time, correlated monitoring that is standard practice in IT. The gap is closing, but there is much more ground to cover.
The Schneider Electric GeoSCADA Expert dashboard is one example of what is possible when OT telemetry is brought into the same observability model as IT infrastructure. By ingesting SCADA logs into Dynatrace Grail, teams can correlate host-level metrics such as CPU, memory, and disk usage with SCADA-specific KPIs such as lock contention, sync lag, and queued events. That combined view can help operators detect degradation earlier, investigate root causes across Purdue layers, and take action before issues become service disruptions or public safety risks.
For organizations operating under IEC 62443, NERC CIP, NIS2 (EU), or similar regulatory frameworks, this level of observability also provides the audit trail and anomaly detection capabilities that compliance requirements increasingly demand. As OT environments become more connected and regulatory scrutiny intensifies, the ability to demonstrate real-time monitoring and incident traceability across both IT and OT layers is rapidly shifting from a best practice to a baseline expectation.
In the next blog, we will walk through exactly how to monitor SCADA systems using Dynatrace, covering log ingestion, dashboard design, and alerting strategies for operational technology environments. Stay tuned.
Want to learn more? See how Dynatrace can address your unique needs with a custom demo.
Dynatrace and Grail are trademarks of the Dynatrace, Inc. group of companies. Schneider Electric and GeoSCADA are trademarks of their respective owners. All other trademarks are the property of their respective owners.

Looking for answers?
Start a new discussion or ask for help in our Q&A forum.
Go to forum