Federal Government
Modernize your agency with automatic and intelligent observability
Get AI-powered awareness of your mission systems and applications. Explore what we do, or talk to a government expert for a free trial.


The State of Observability in public sector organizations
Public sector organizations are turning to advanced AI, analytics, and automation capabilities to overcome the complexity of modern technology stacks. However, many have seen limited value from their initial analytics and automation strategies.
- 82% of organizations have already adopted AIOps to reduce the complexity of managing their multicloud environment, and a further 12% plan to adopt it in the next 12 months.
- 98% of technology leaders say probabilistic machine learning approaches have limited the value that AIOps tools deliver due to the manual effort teams need to invest.
- 78% of technology leaders say the maturity of AI, analytics, and automation capabilities will play a more important role in how they choose vendors and partners.
What we do
Who we serve

Civilian Agencies
Accelerate your modernization efforts, cloud migration journey, ensure perfect user experiences for the digital citizen, and more.

Intelligence Community
Secure your data, drive organizational resilience, and get real-time situational awareness into the most critical of systems.

Department of Defense
Get unparalleled situational awareness into the most complex systems, enhance DevSecOps capabilities, and drive overall mission readiness.

Federal System Integrators
Get 360-degree AI-Assisted performance management to help exceed present-day service level agreements and emerging future needs.


Some of our customers include:


PODCAST
More than meets the eye

Supporting the U.S. Federal Government with automatic and intelligent observability
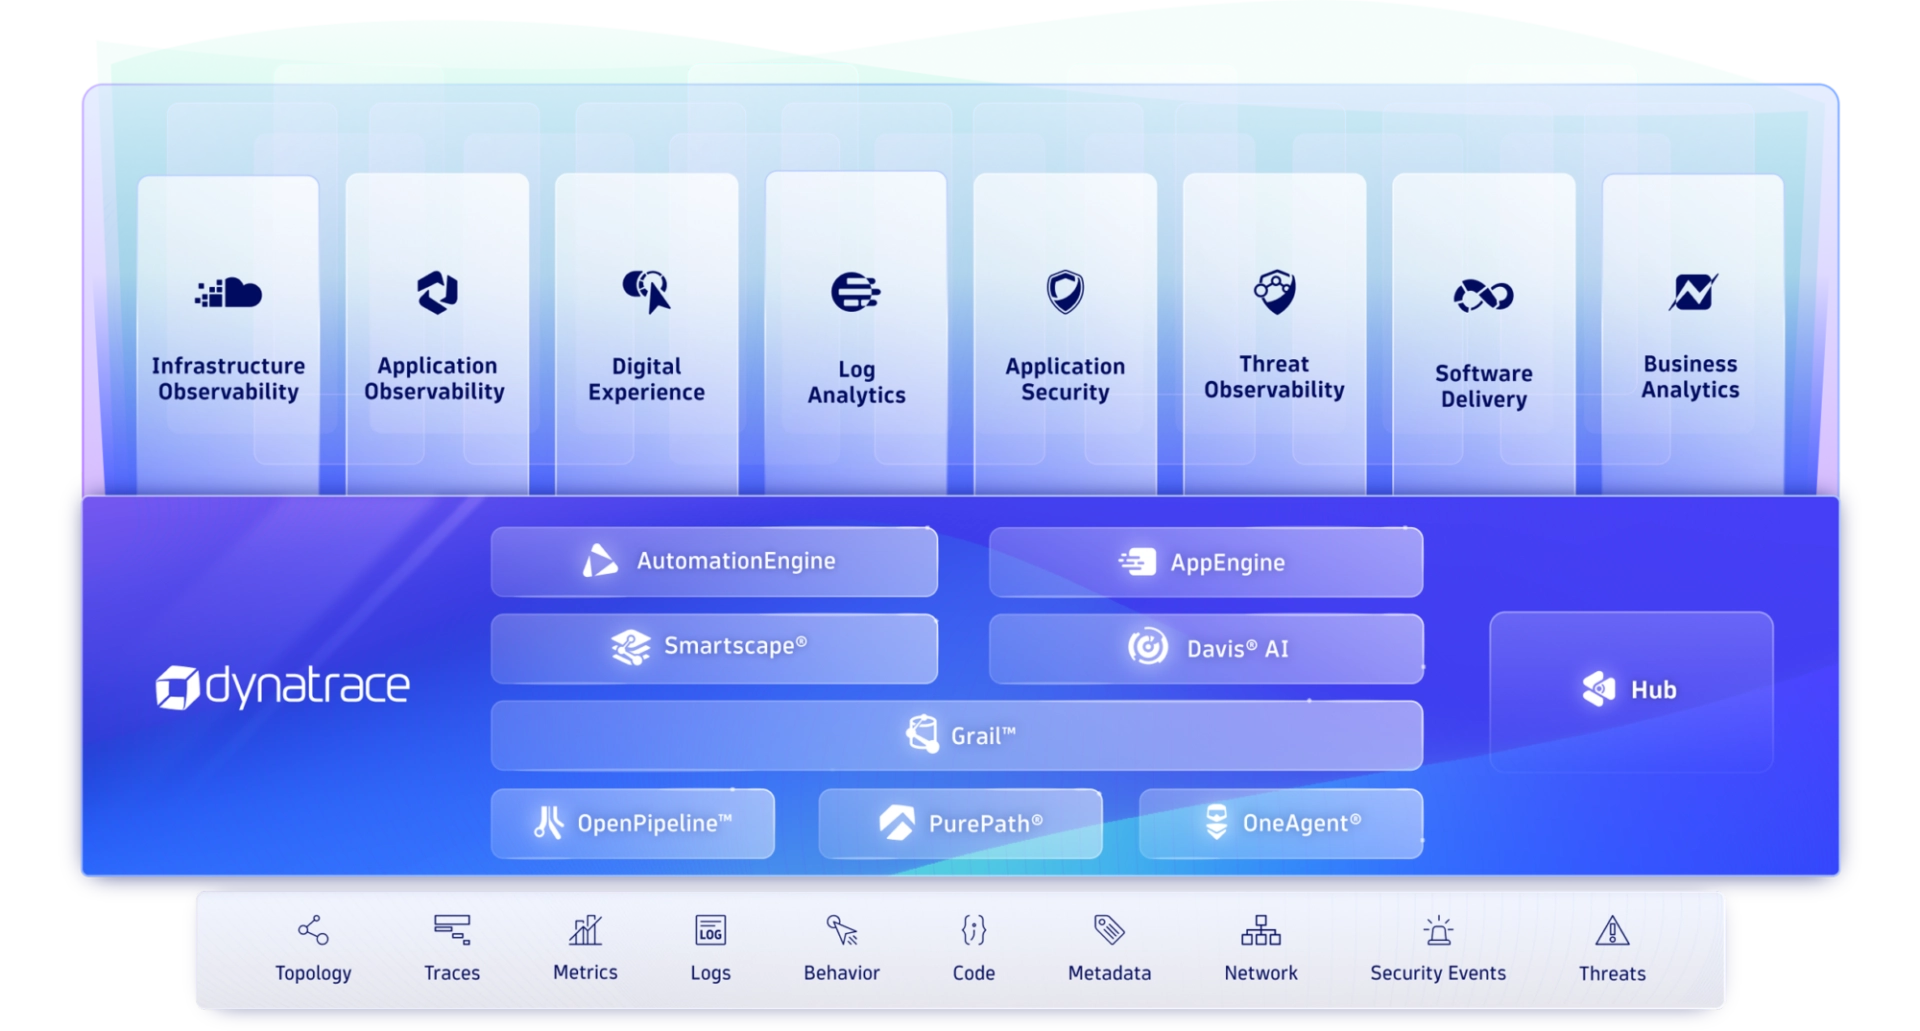
We deliver observability that's more than metrics, logs, and traces – it's observability, automation, and intelligence in one platform.
Compliance & certifications
We take a security-first mindset in all we do, and our commitment extends to ensuring that we maintain the certifications that matter to the Federal Government.
FedRAMP
SOC2 Type II Certification
CSA (CAIQ)

Penetration test
FIPS 140-2
Americans with Disabilities Act VPAT 2.0 for Section 508 Compliance
Multiple DoD/IC ATOs


Related resources
 How Dynatrace’s observability protects government apps
Free Whitepaper
Creating smarter, safer government applications
Learn how unified observability and security from the Dynatrace for Government platform delivers the automatic and continuous protection agencies need to guard and evolve against ever-changing threats.
FREE EBOOK
Delivering better user experiences with unified observability Dynatrace simplifies cloud complexities, boosts application security, and helps organizations accelerate digital transformation.
 Webinar: Manage and Secure Complex IT environments
 Demystifying Artificial Intelligence
 Modernizing Government Mission with AI
 Webinar: New Research on Government IT Modernization: Opportunities for 2022
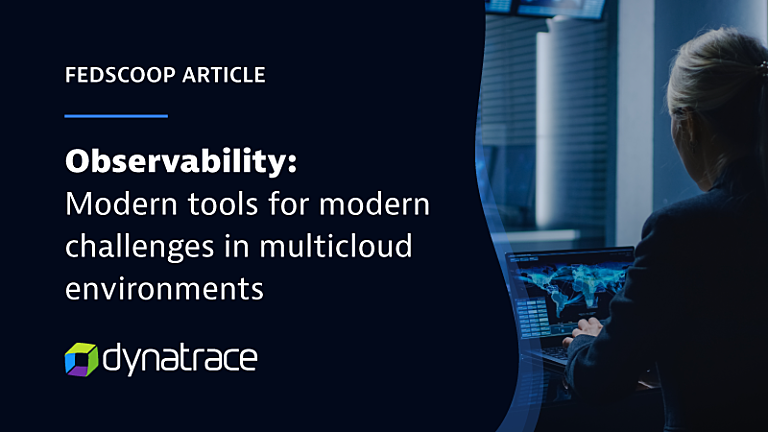 Observability: Modern tools for modern challenges in multicloud environments
Infographic
10 steps to Government agency AI readiness
Automation through artificial intelligence provides a solution for greatly simplifying cloud complexity while accelerating digital transformation. AIOps: Cost-effective, end-to-end observability to improve mission outcomes
 Artificial Intelligence Operations-Enabling Government Agencies To Do More With Less
 The VA’s Journey to Modernization
 Automatic and intelligent end-to-end observability for OpenTelemetry Java
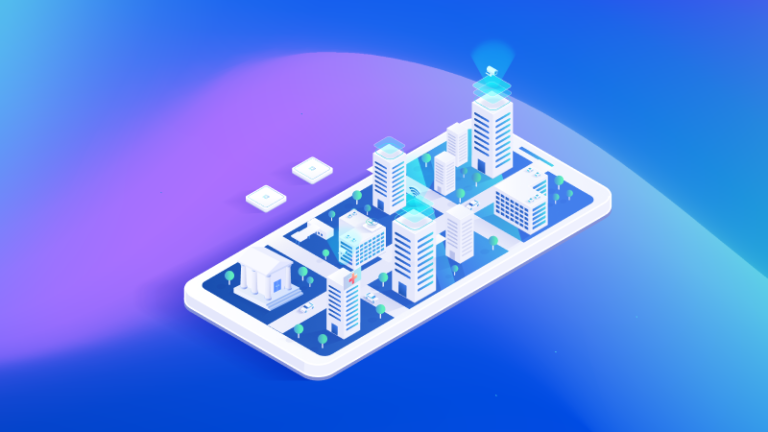
Infographic
How government IT leaders are overcoming cloud complexity
Public sector and government organizations are under pressure to manage complex cloud-native architectures and deliver seamless experiences to digital-first citizens.Whitepaper
Using AI-driven observability throughout the software life cycle ensures the ongoing performance and security of applications


Insights from our experts
 Real time application observability will accelerate mission innovation if you trust AI
 It’s time to trust AI: Observability will accelerate mission innovation
 Implementing zero trust for federal agencies
 Automatic and intelligent observability to empower mission success
 Observability: How to lead your federal agency to a digital transformation
 Federal agencies identify top IT modernization challenges
 Enabling IT modernization through observability and security analytics and automation
 Ebook - The Road to AIOps in the Federal Government
 Automatic and Intelligent Observability: Fast Track to Better User Experience
eBook
AIOps done right: Automating the Next Generation of Enterprise Software Webinar: Federal Cloud Migration with Dynatrace
 Power Demo: Advancing your agency’s mission with the Dynatrace for Government SaaS platform (FedRAMP Part 1)
- Webinar: Getting started with your Dynatrace for Government Environment (FedRAMP Part 2)
 Accelerating workloads to Red Hat OpenShift
 DLT ContinuousX Podcast featuring Dynatrace


Get a free trial
