Real user monitoring (RUM)
AI powered, full stack, automated - Dynatrace brings new levels of observability and insight into the customer digital experience through the perspective of the end user in real time.

Unmatched monitoring visibility
Dynatrace is the only vendor to capture the full visibility of customer experience across every digital transaction. No sampling of data, Dynatrace gives you a complete picture, from the frontend to the backend.
- Gapless insight - map the whole user journey, not just bits and pieces
- Awareness into performance issues and potential business impact
- Resolve problems proactively with real-time data
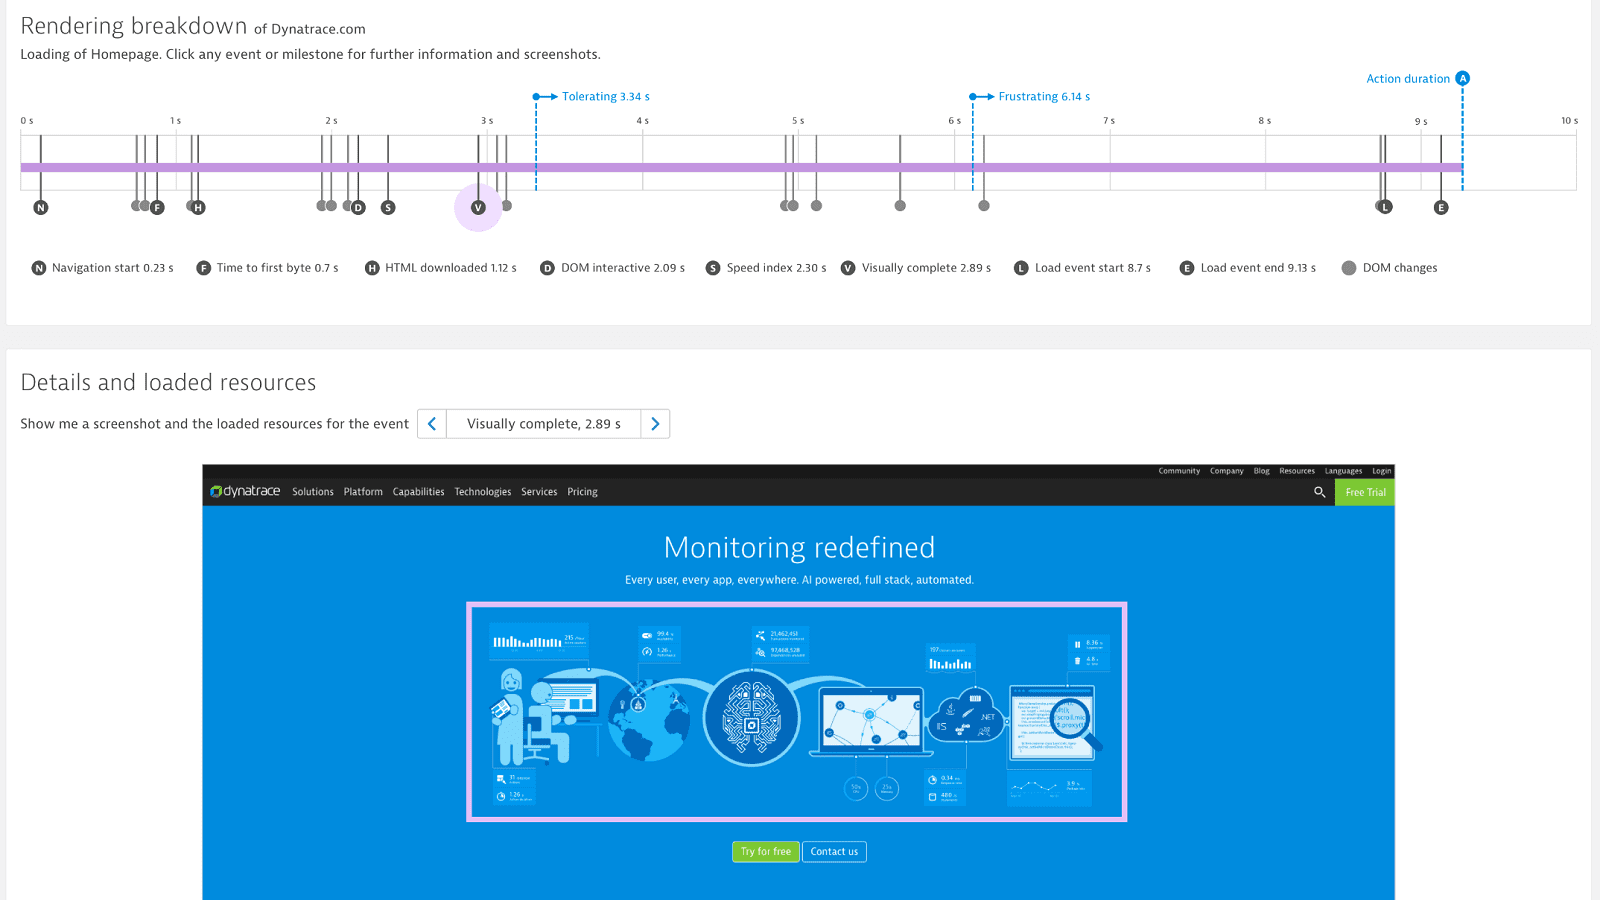
Eliminate blind spots with Dynatrace visually complete
Correlate visual performance to digital business outcomes automatically. Dynatrace Visually complete is the only solution to eliminate user experience blind spots and provide the most accurate and relevant measurement of user experience. Core benefits of Visually complete:
- 100% observability to actual real user experiences
- Accelerate performance improvement
- Align IT and business to connect UX with business outcomes
- Optimize decisions across development, operations and user journey
Just a few of our enterprise customers
Try real user monitoring with Dynatrace now!
Start Free TrialMonitor user journeys
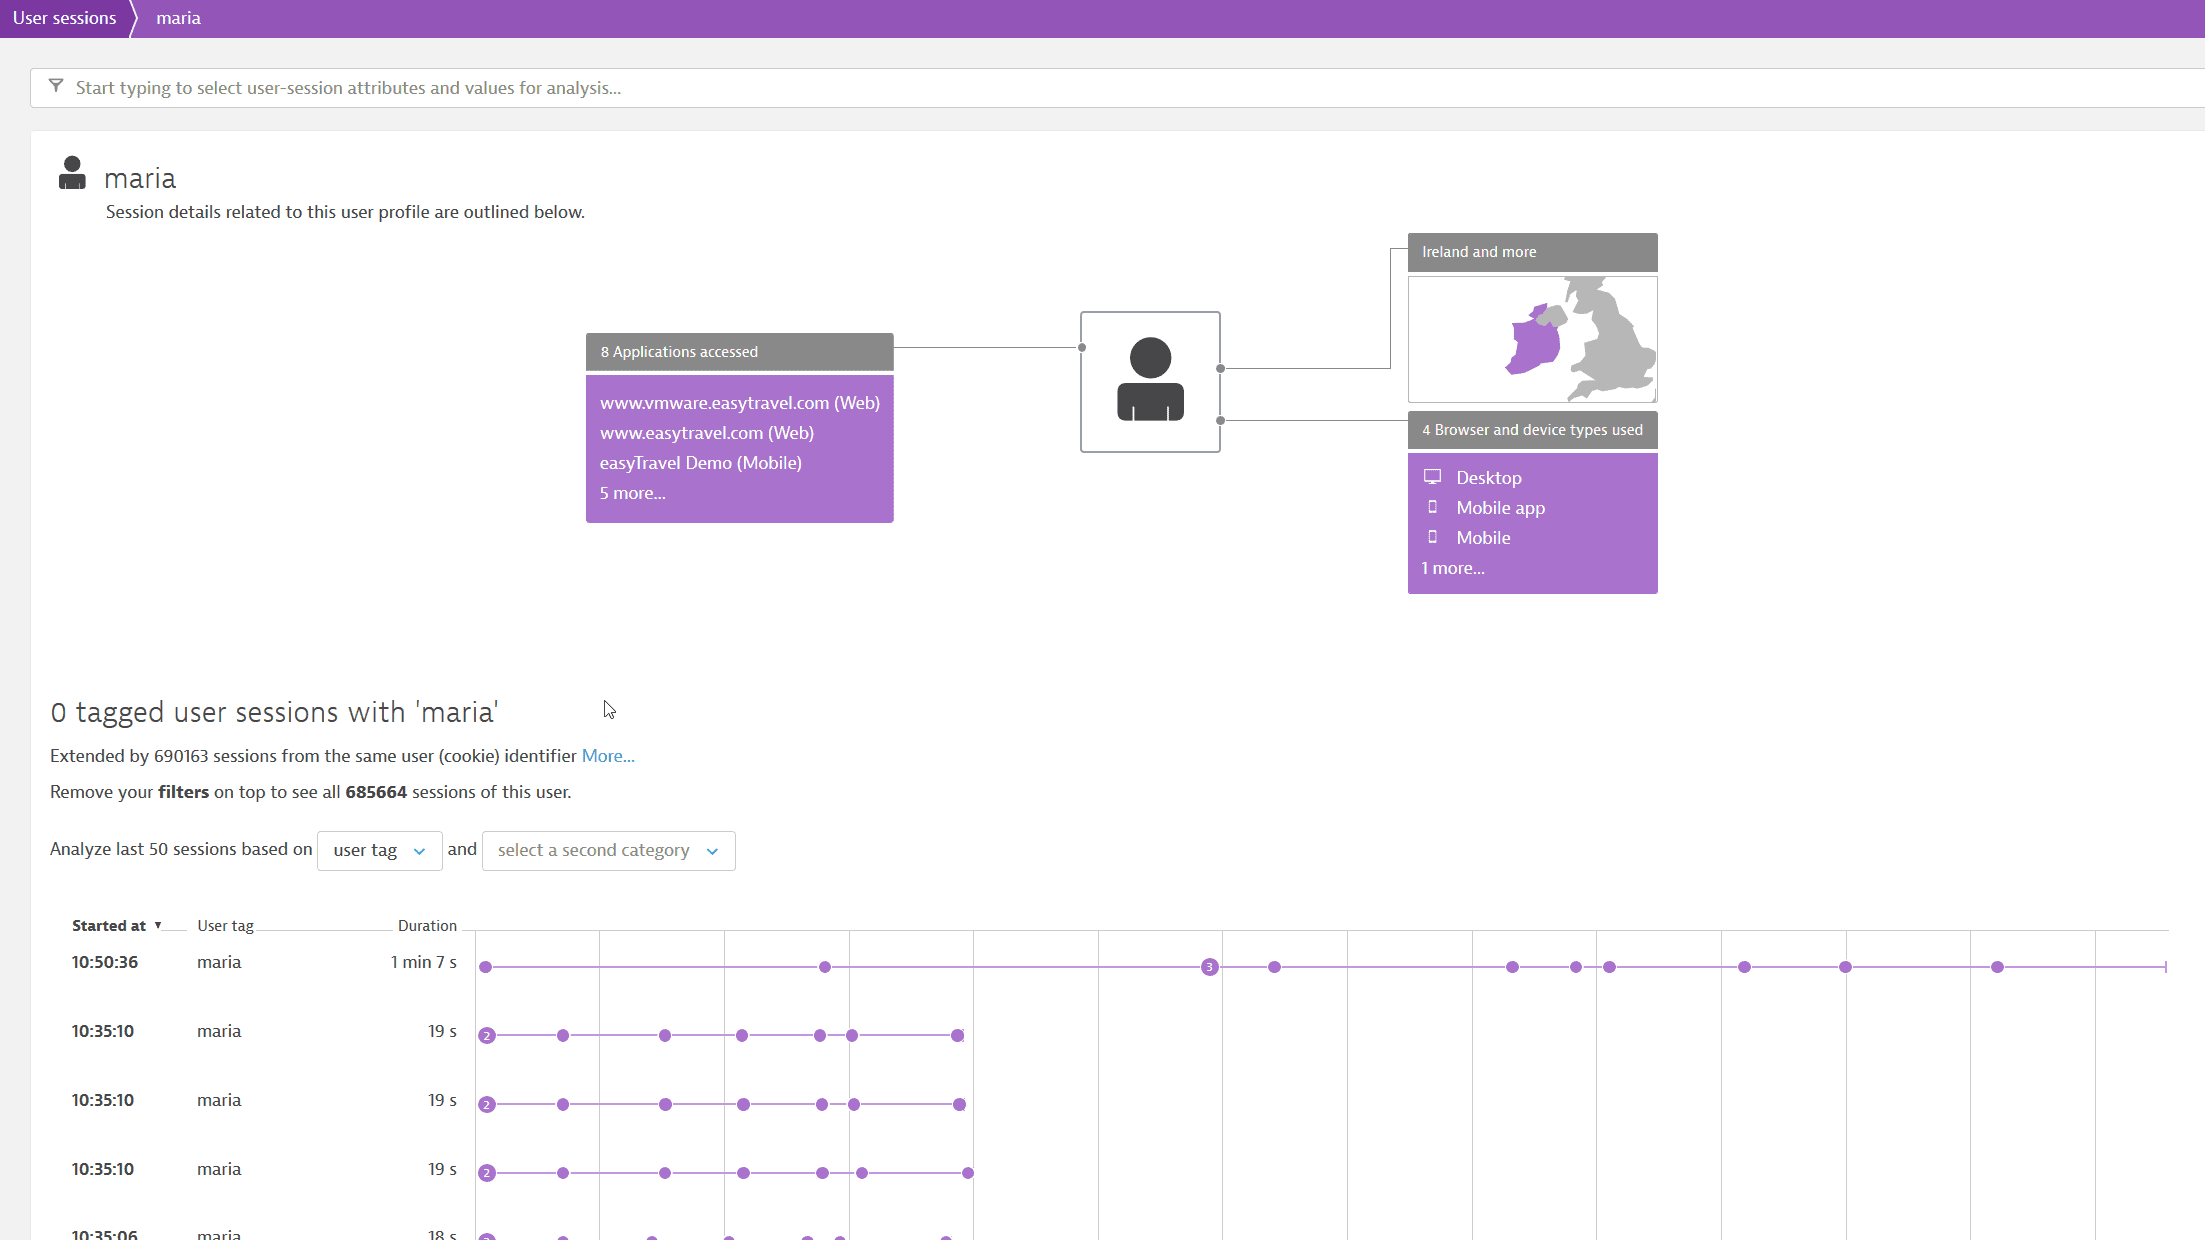
- Dynatrace shows all user sessions and their click path
- Ability to understand why an error is happening
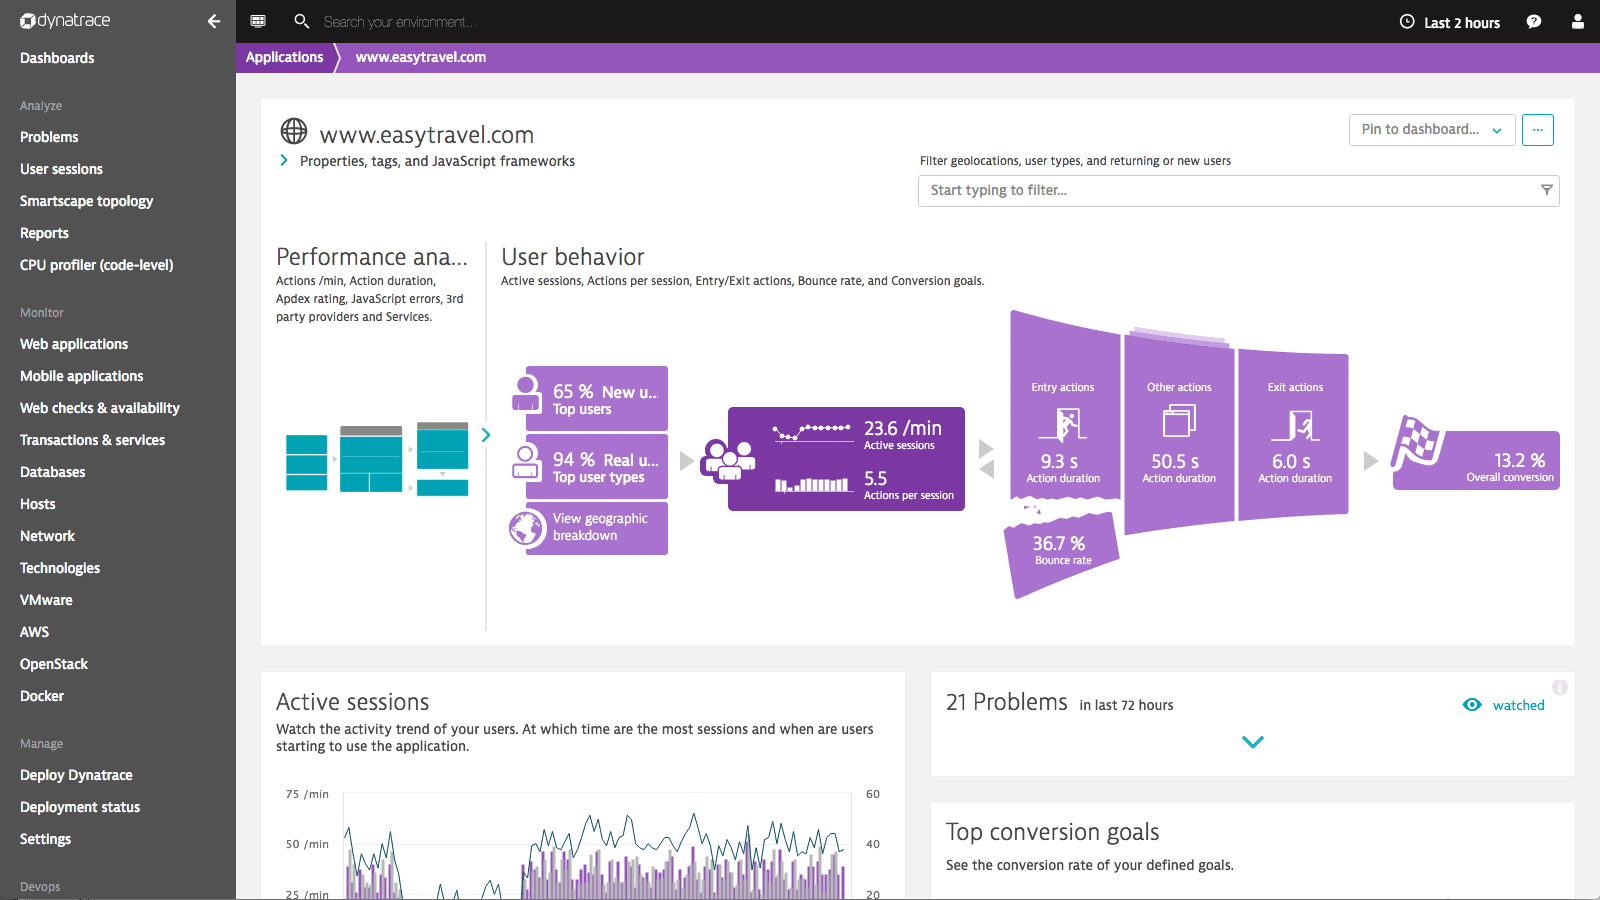
- Compare bounced user sessions, converted user sessions or new versus returning users to understand your customer base
Excel in complaint resolution
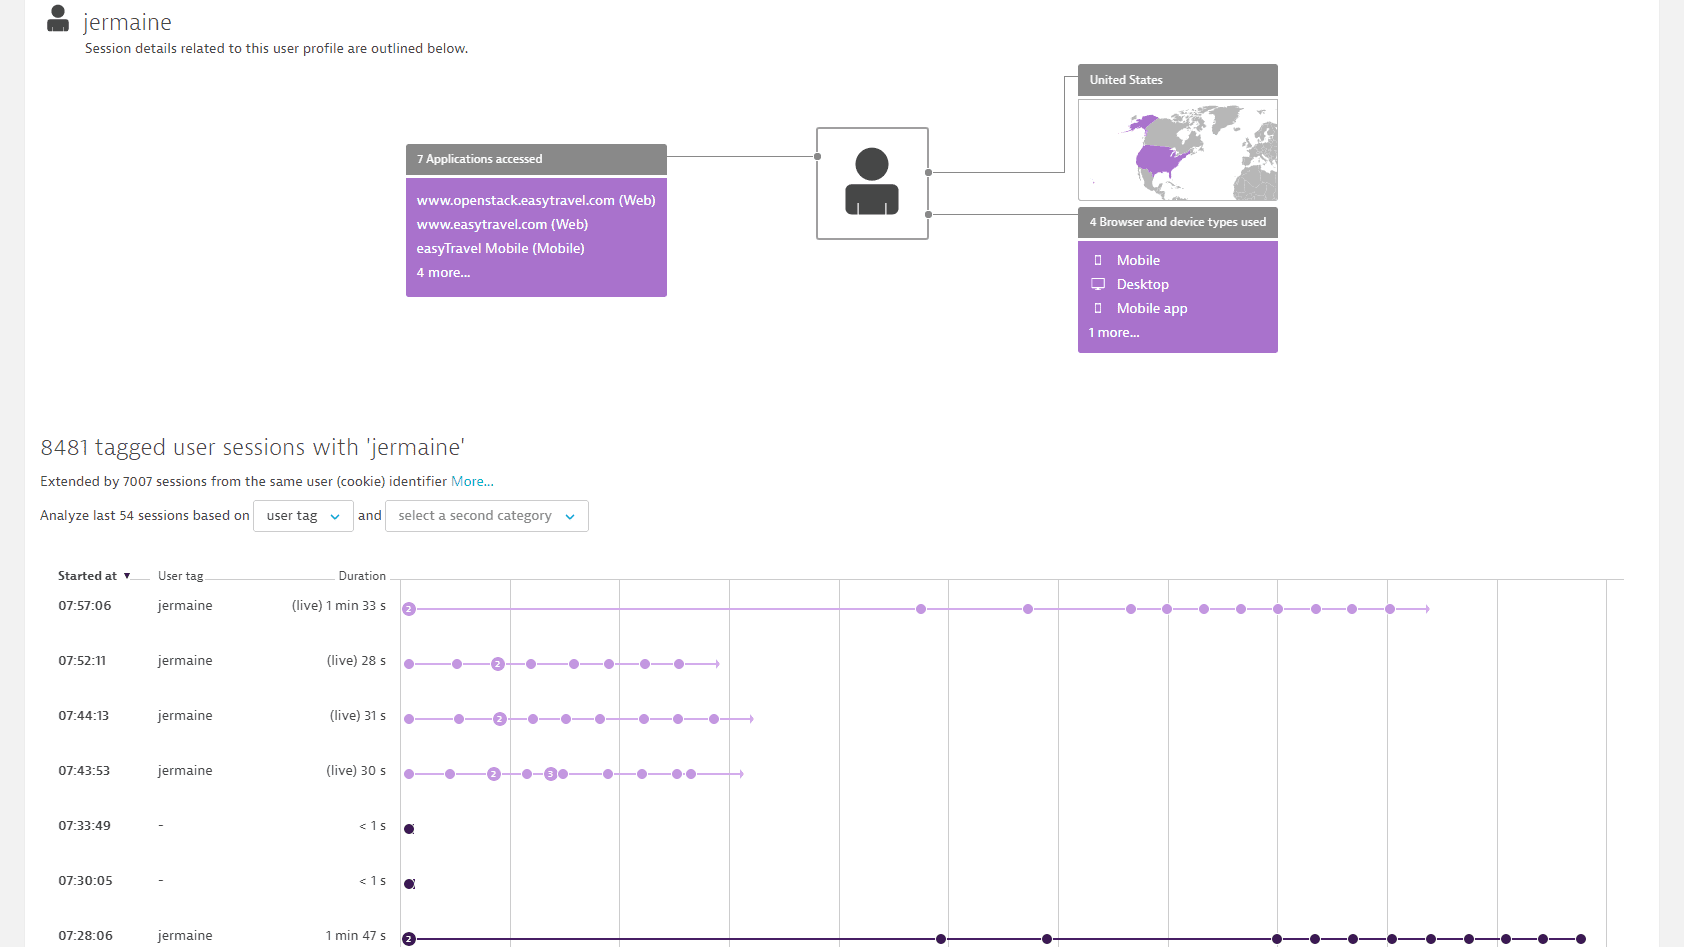
- Replay individual customer transactions for rapid problem handling
- Dynatrace artificial intelligence pinpoint issues and drill down to root-cause
- Proactively contact customers when things go wrong and prevent poor app ratings
Cut mean time to repair by 90%
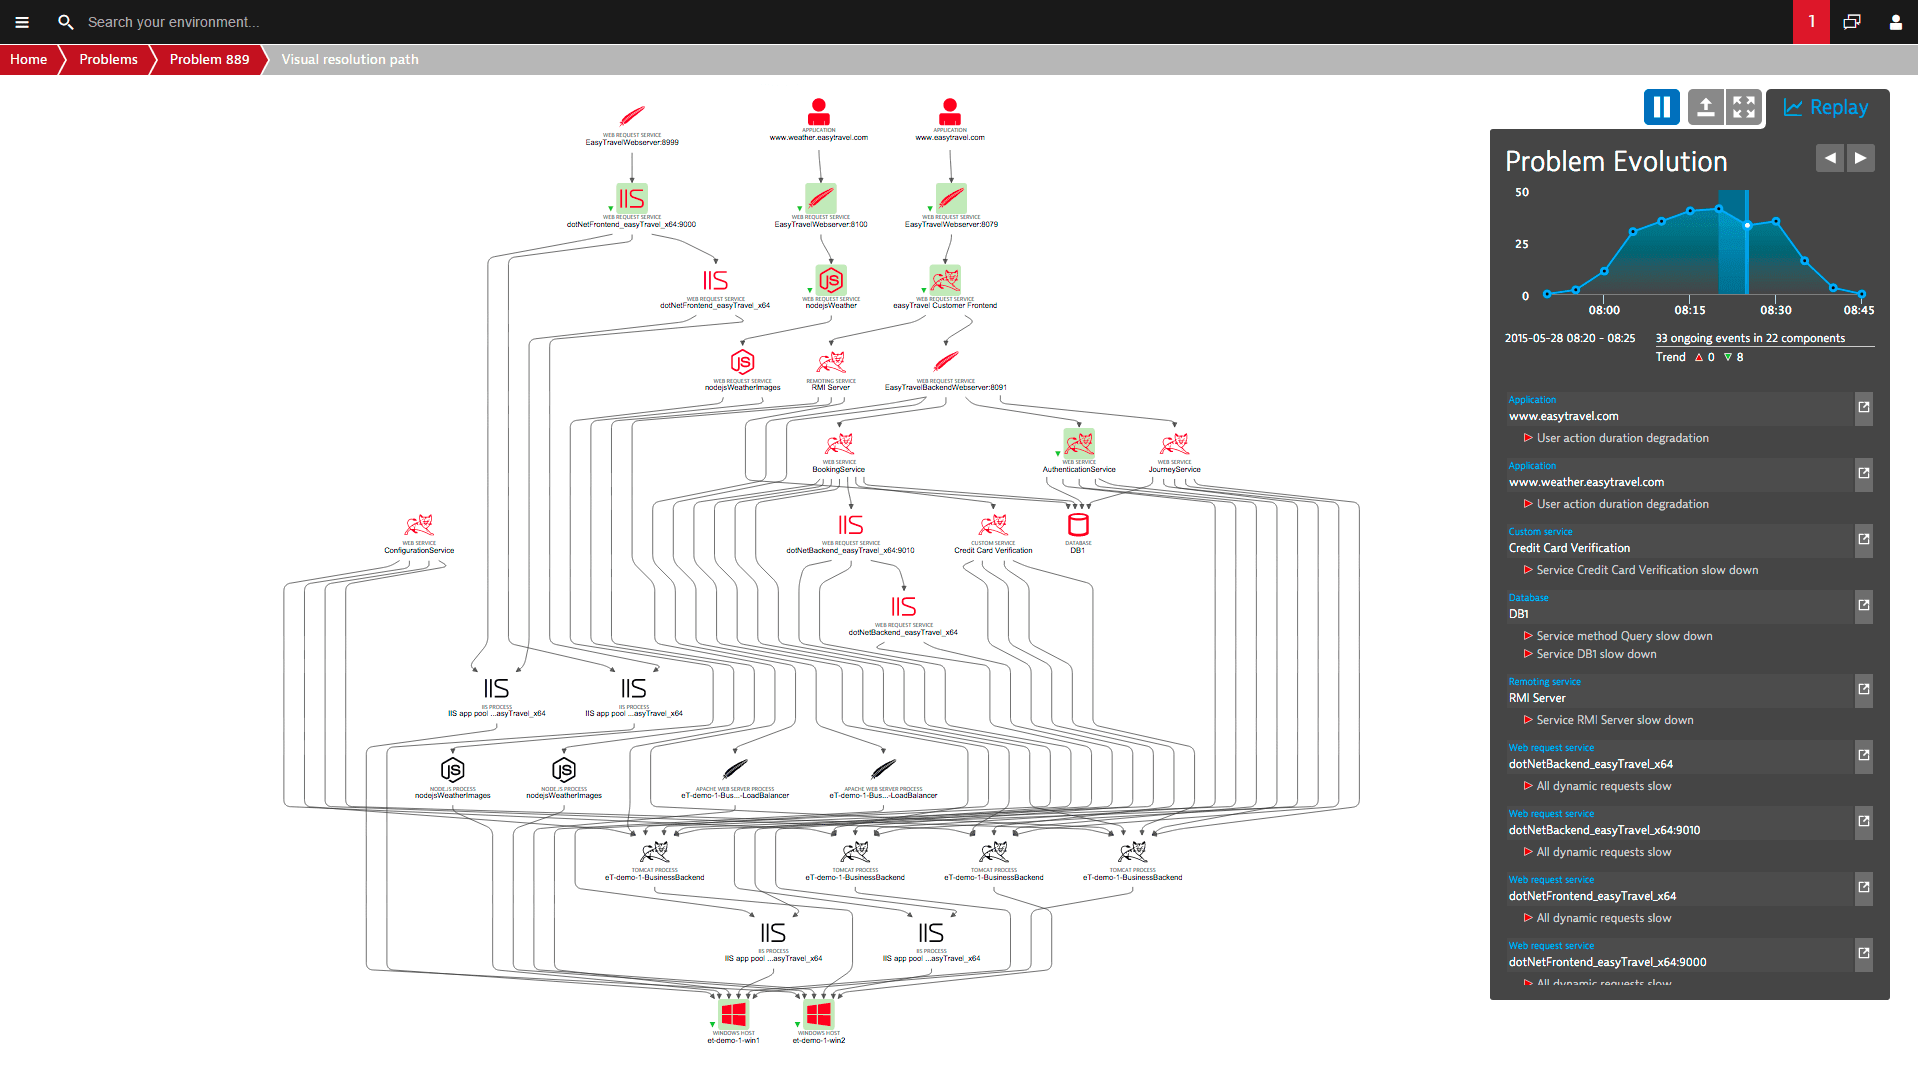
- Dynatrace provides a single problem notification that identifies the root cause
- AI understands causation throughout your entire IT environment
- Only Dynatrace can reliably uncover the underlying cause of performance issues
- Gain a head start in bug fixing through deep-dive analysis into source code & database statements
Identify and resolve technical issues proactively
See it all, from the edge to the core
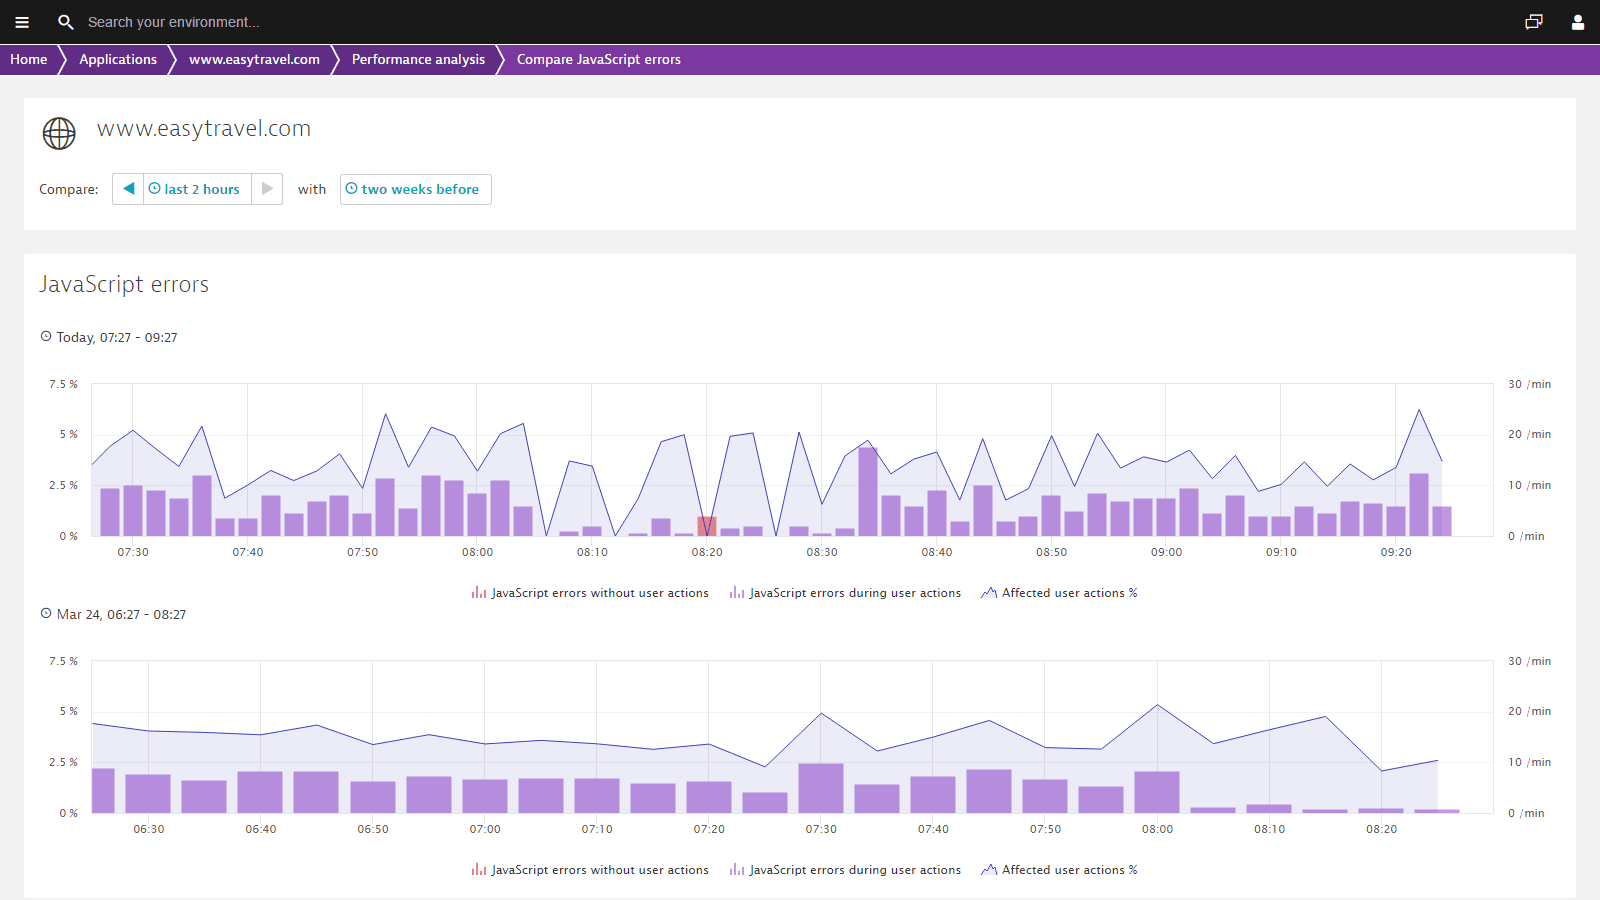
- View JavaScript error messages, know the user actions that triggered them, and view the stack traces
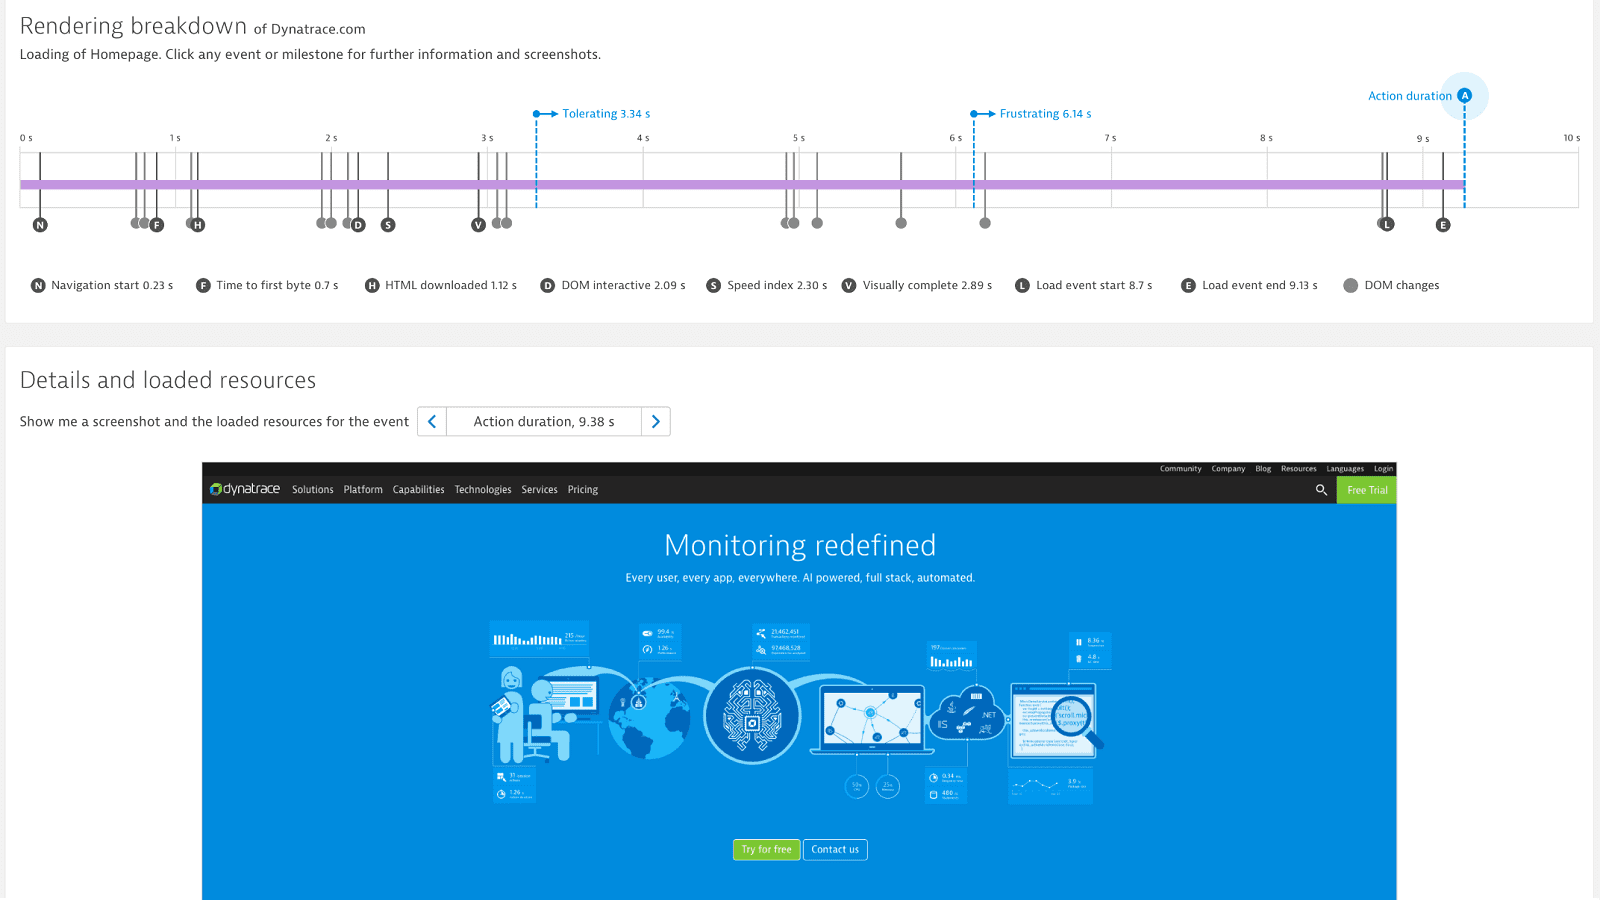
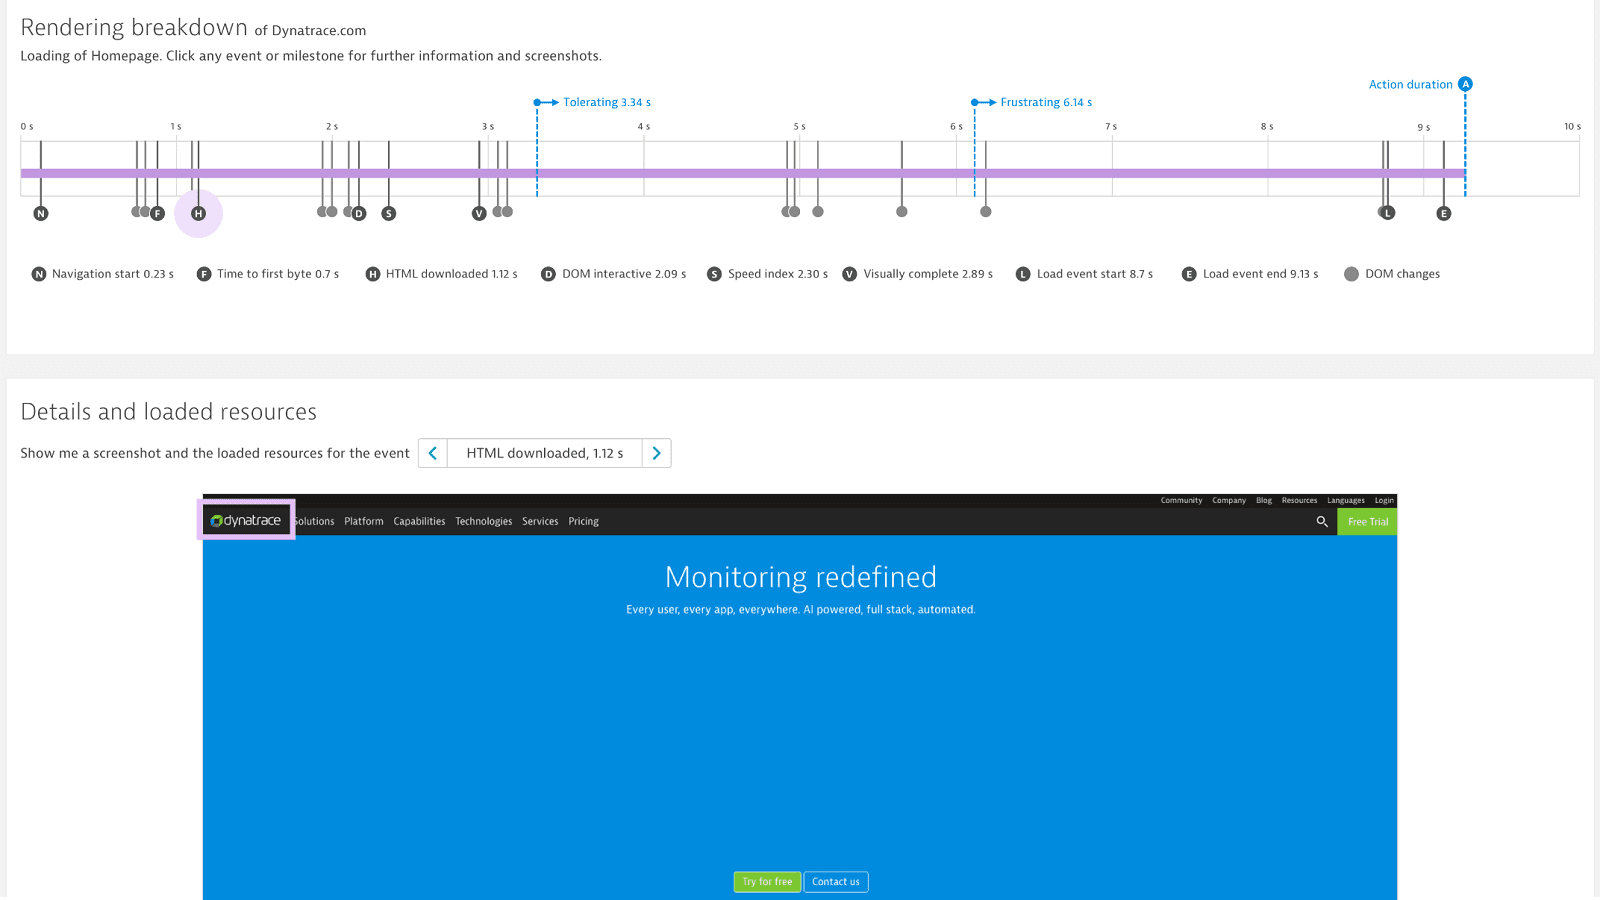
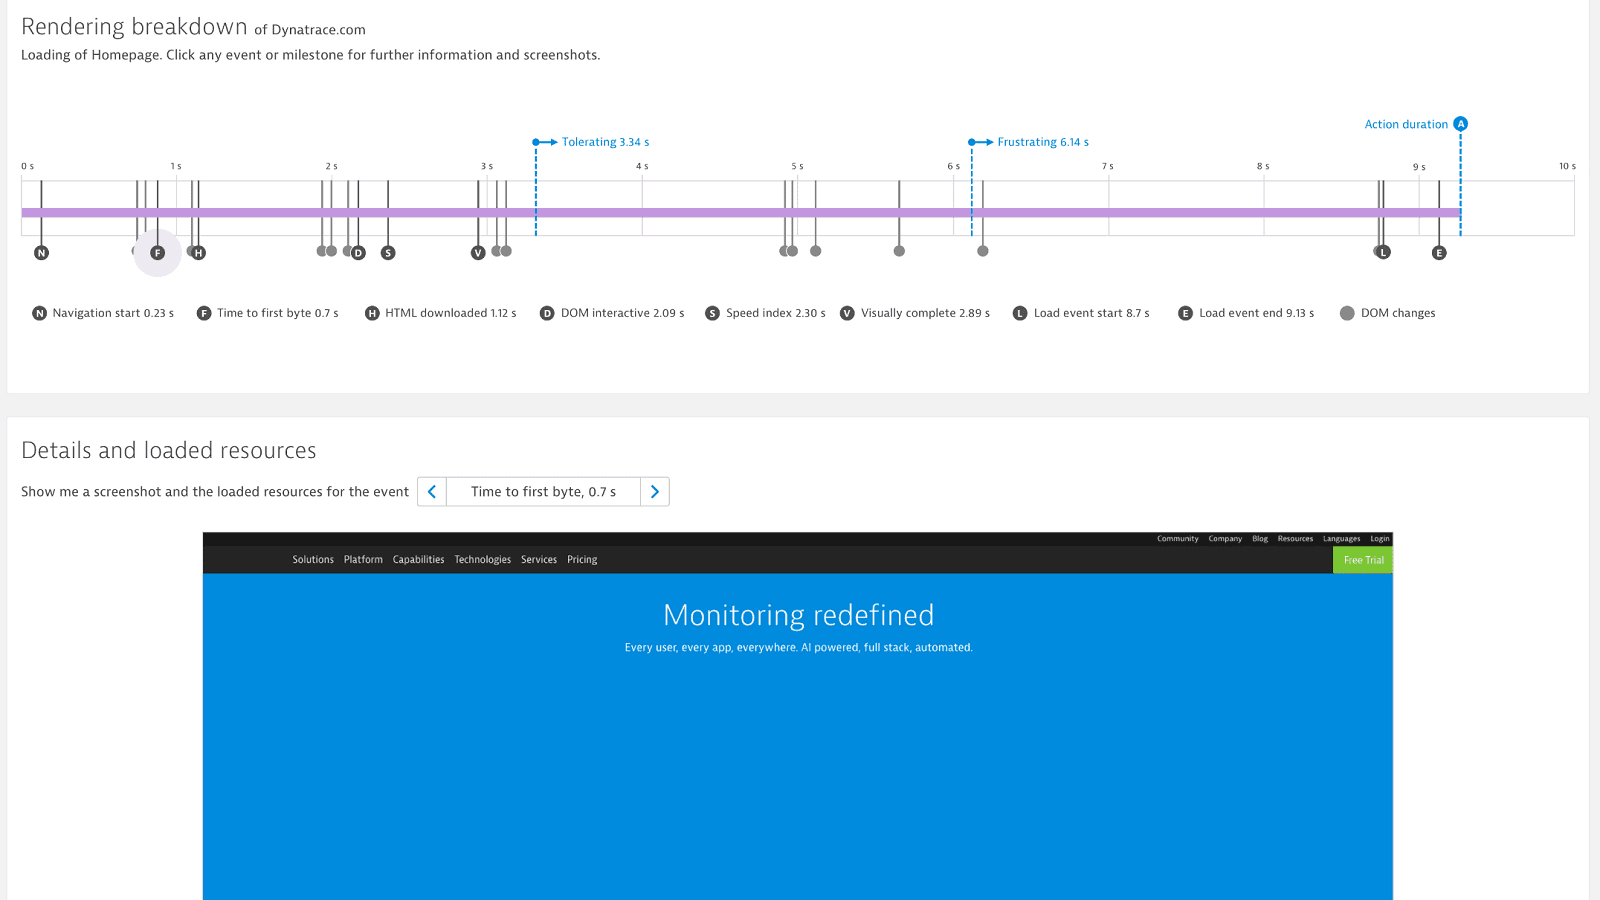
- Go beyond time-to-first-byte, DOM-interactive, or full page load
- Start optimizing for Visually complete and Speed index
Drilldowns for data analysis
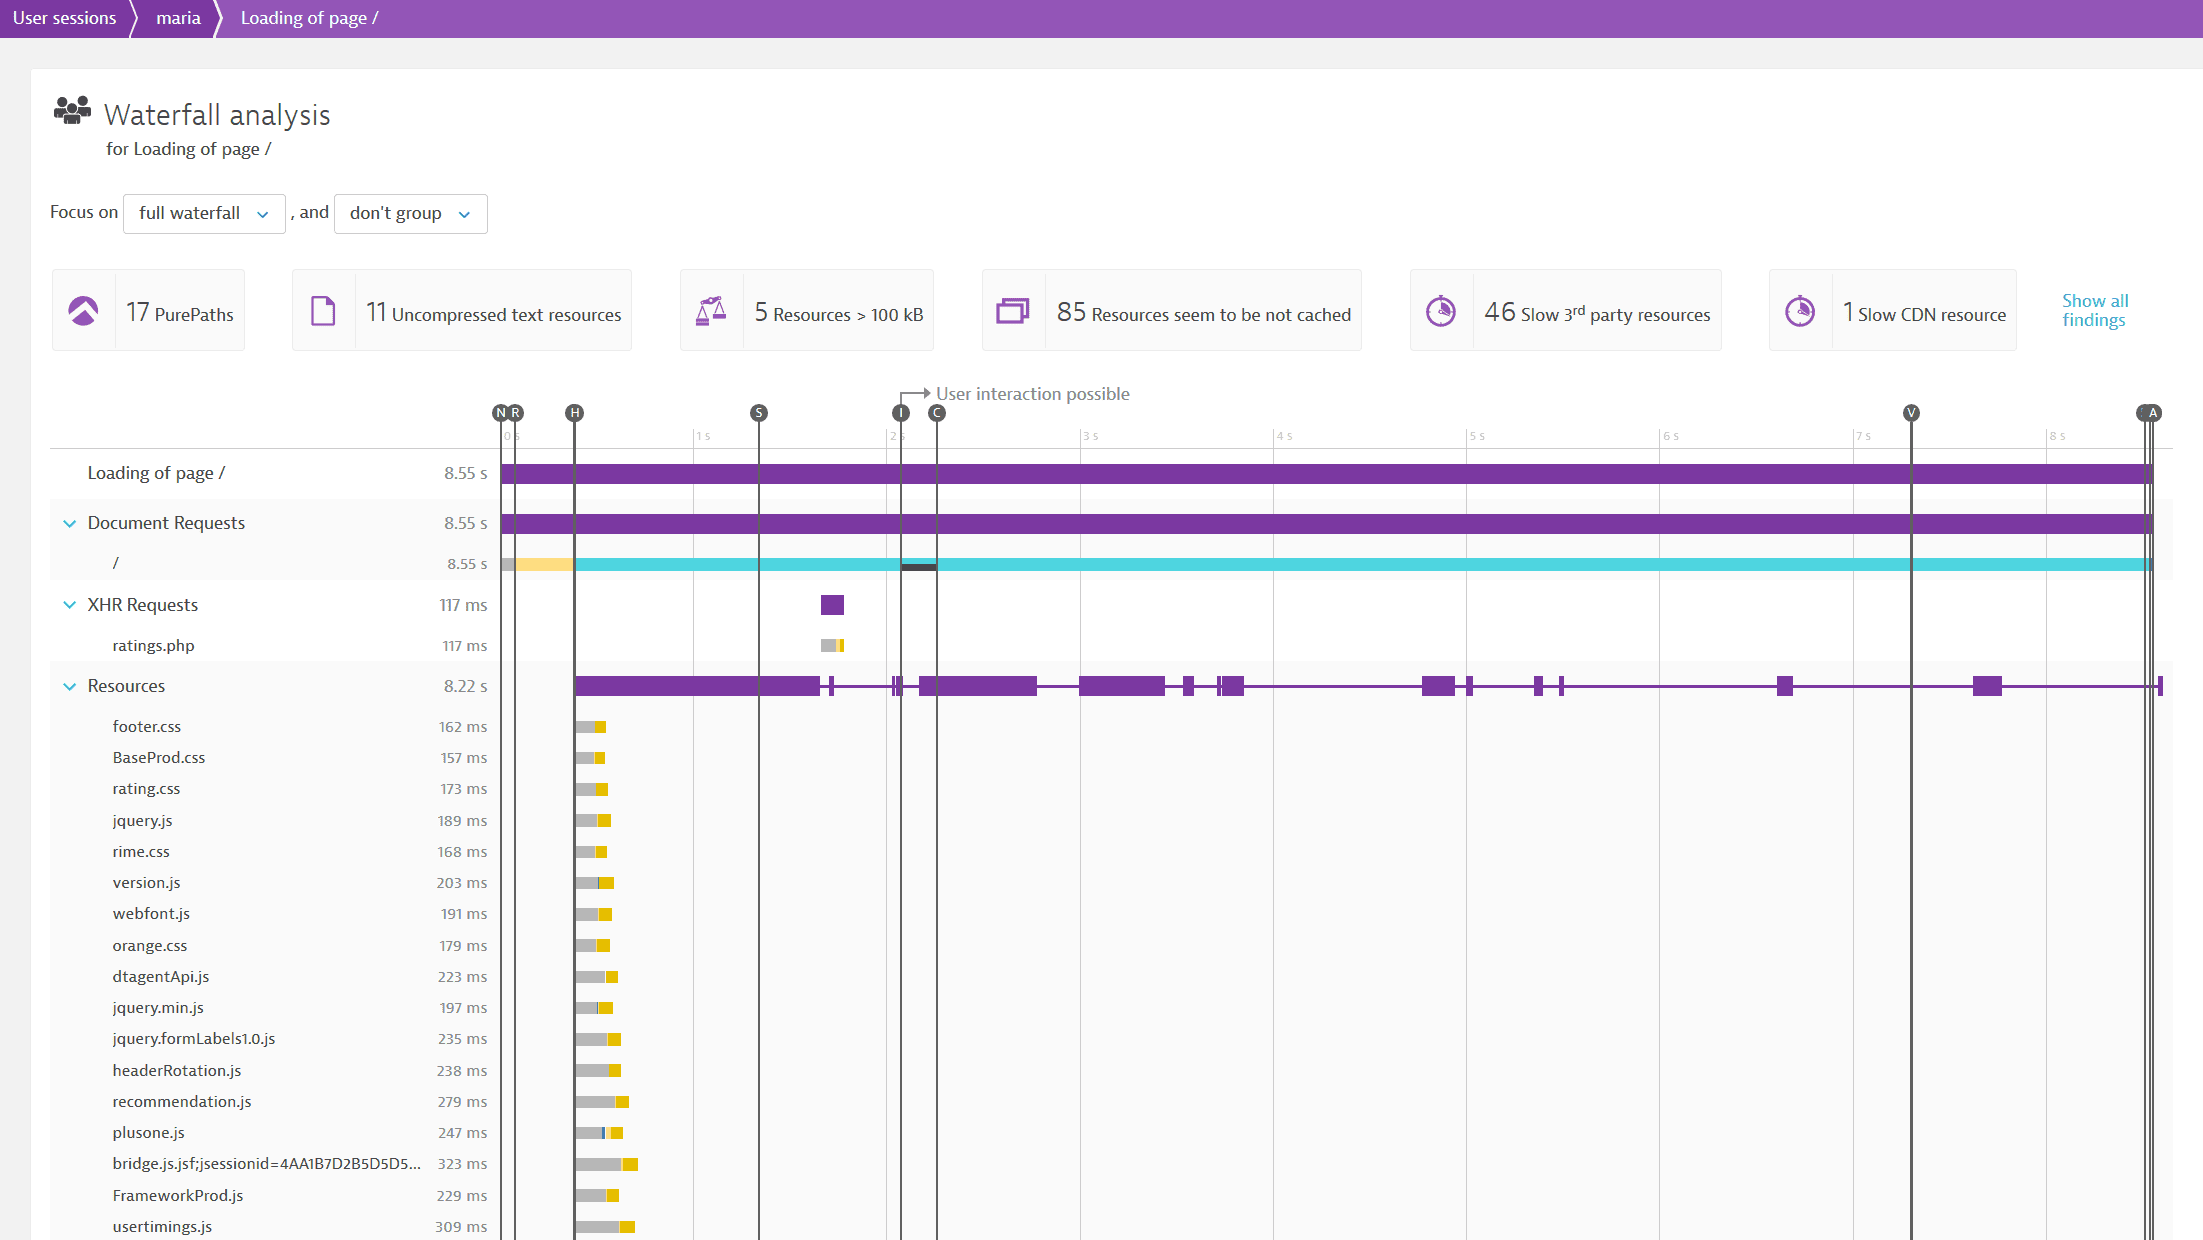
Dynatrace gives you insights in relevant metrics of your users. The so called Waterfall analysis allows you to gain:
- Bytes downloaded
- Interactive time
- Network time
- UX time
- Visually complete
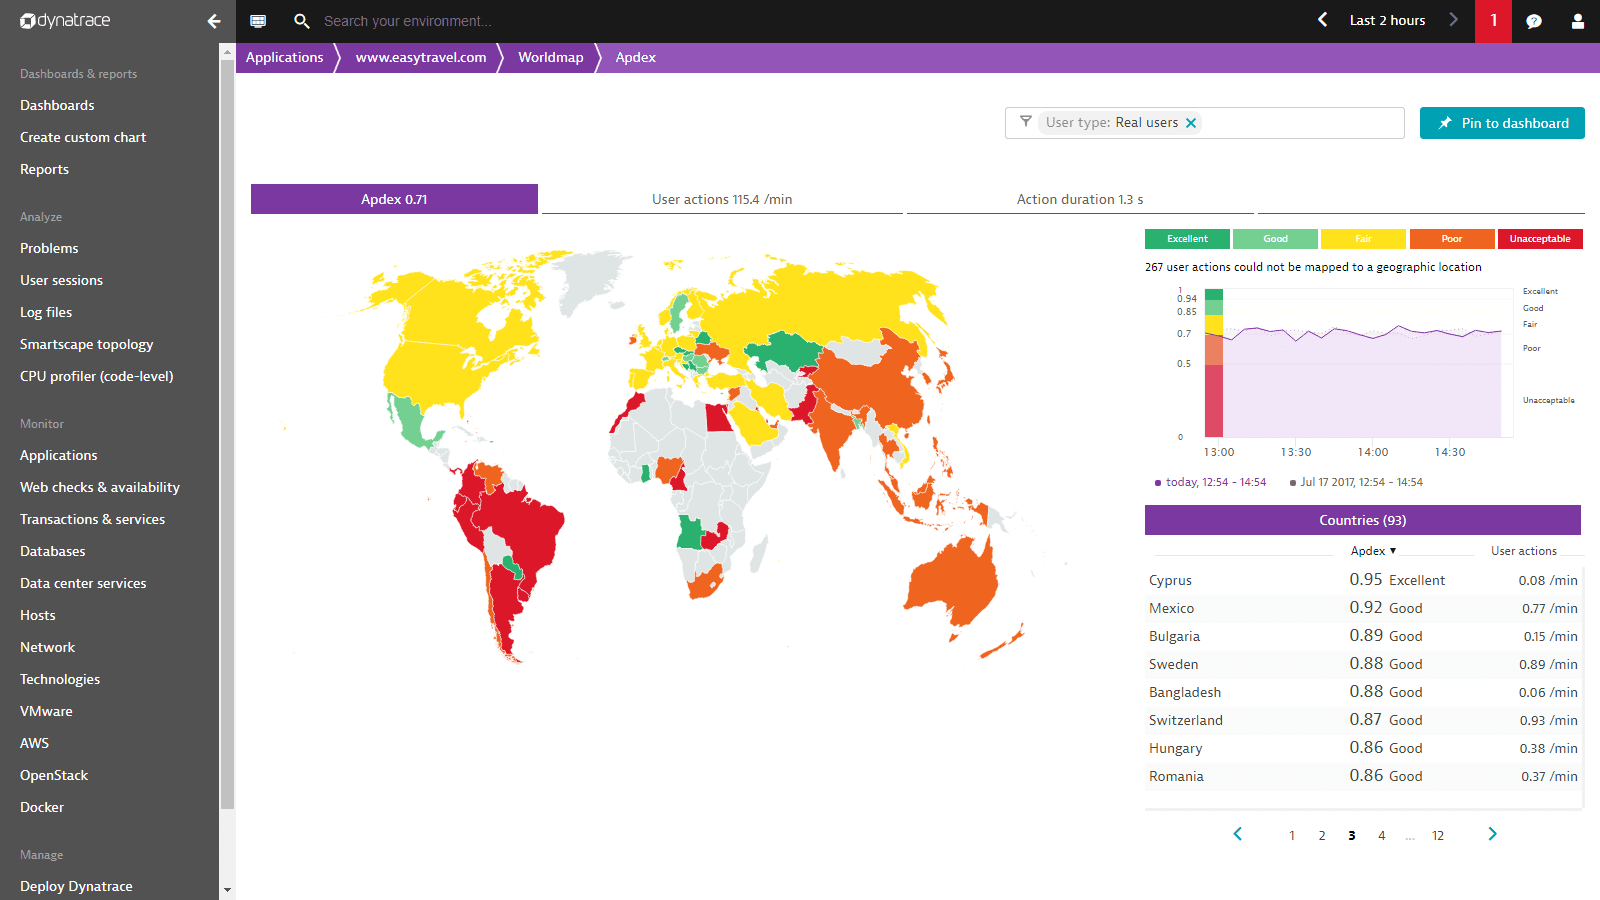
4 different use cases of real user monitoring
Watch how Dynatrace AI provides the root cause to any real user impact and the business insights delivered by real user monitoring. This 30 minutes session covers all details around Dynatrace real user monitoring and its benefits.

Strategy made simple
You need built-in expertise to lead the way—and we’ve got it. The Digital Experience Insights service is designed to drive an active mobile performance optimization strategy and culture even if you don’t have a lot of time or resources in-house. Start today and unleash your maximum potential.
Sign up for Dynatrace real user monitoring today!
Start Free TrialDynatrace named a 2021 Gartner
Magic Quadrant Leader
2021 Gartner Magic Quadrant for APM
Named a Leader for the 11th consecutive time
2021 Gartner Critical Capabilities for APM
Scored highest in 4 out of 5 use cases
