DC/OS monitoring
Monitor application and cluster health in highly-dynamic container environments.

What is DC/OS?
DC/OS (Datacenter Operating System) is a distributed operating system that uses Apache Mesos as its kernel. DC/OS automates resource management, schedules process placement, facilitates inter-process communication, and simplifies the installation and management of distributed services.
Mesosphere DC/OS is an open source datacenter-scale operating system. Mesosphere offers the proprietary Enterprise DC/OS as a turnkey enterprise solution.
Enhance visibility into DC/OS clusters
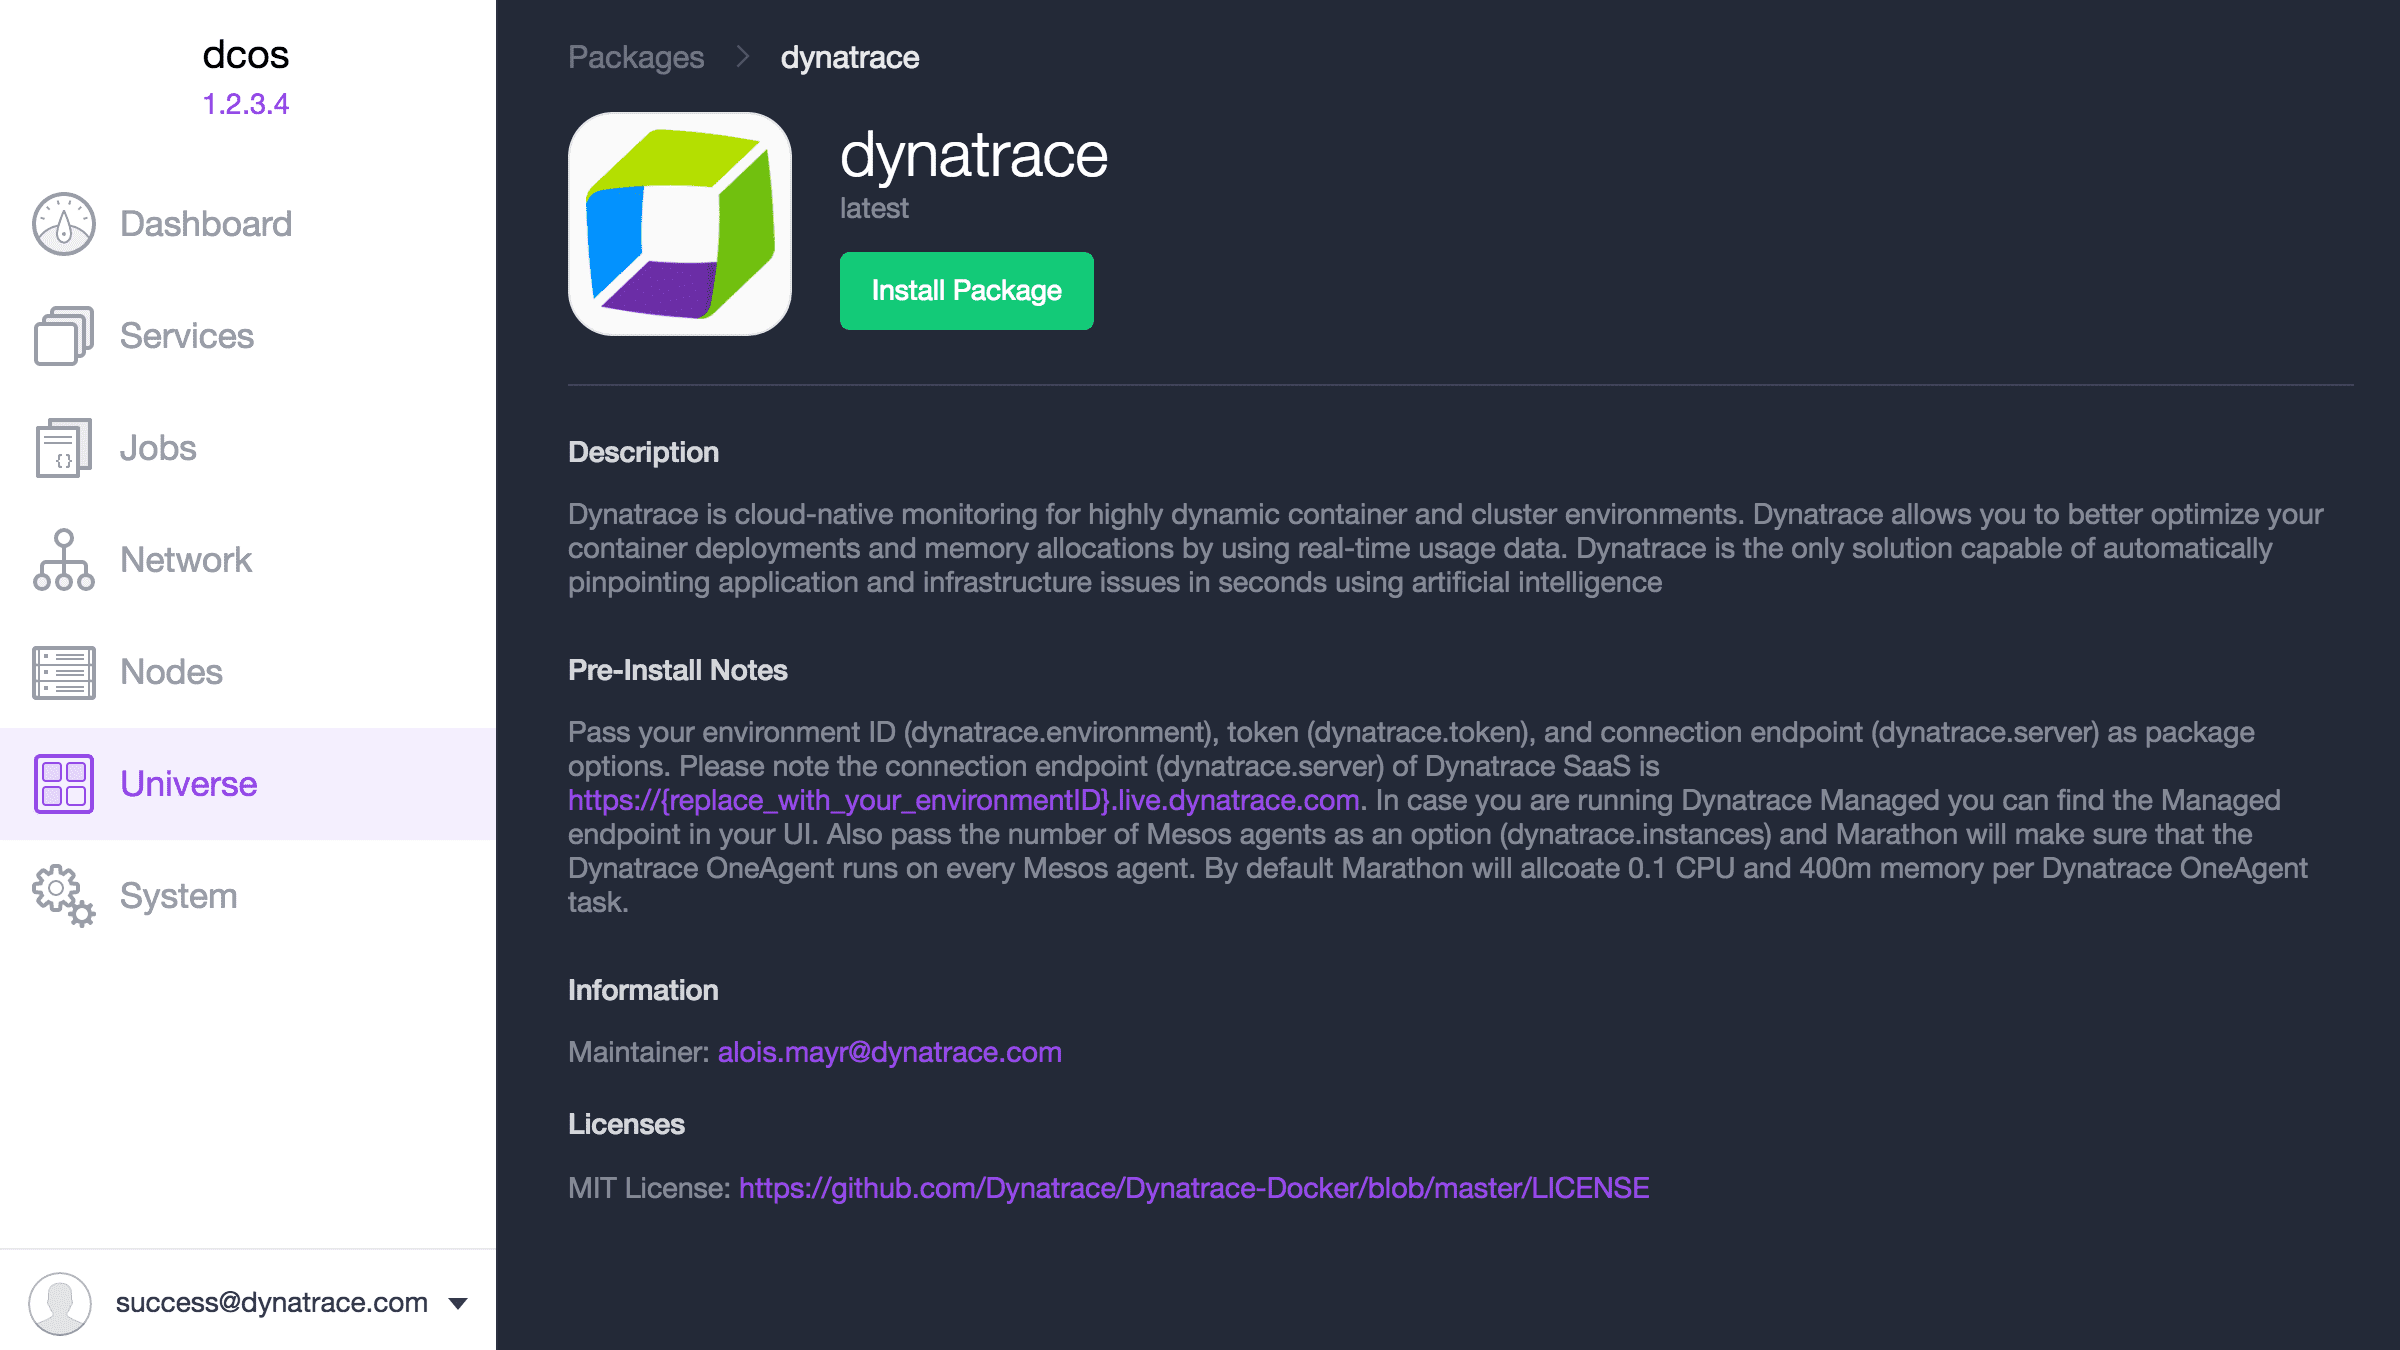
DC/OS is based on Apache Mesos. It provides a rock-solid infrastructure layer for container-based microservices. Using real-time usage data from Dynatrace, you can now better optimize your container deployments and memory allocation.
While DC/OS is an ideal solution for battle-hardened container orchestration, Dynatrace enables you to get deep visibility into the applications you deploy on your clusters. If you’re already using DC/OS, simply install the Dynatrace package via the DC/OS user interface. You’ll need to provide your Dynatrace credentials.
Understand the causes of failing microservices
Manually hunting down elusive performance problems in highly distributed systems can be a time-consuming process. Dynatrace is the only solution capable of automatically pinpointing application and infrastructure issues in seconds using artificial intelligence.
- Dynatrace tells you where and why highly distributed applications break down.
- Stop spending time hunting for problems and focus on fixing them.
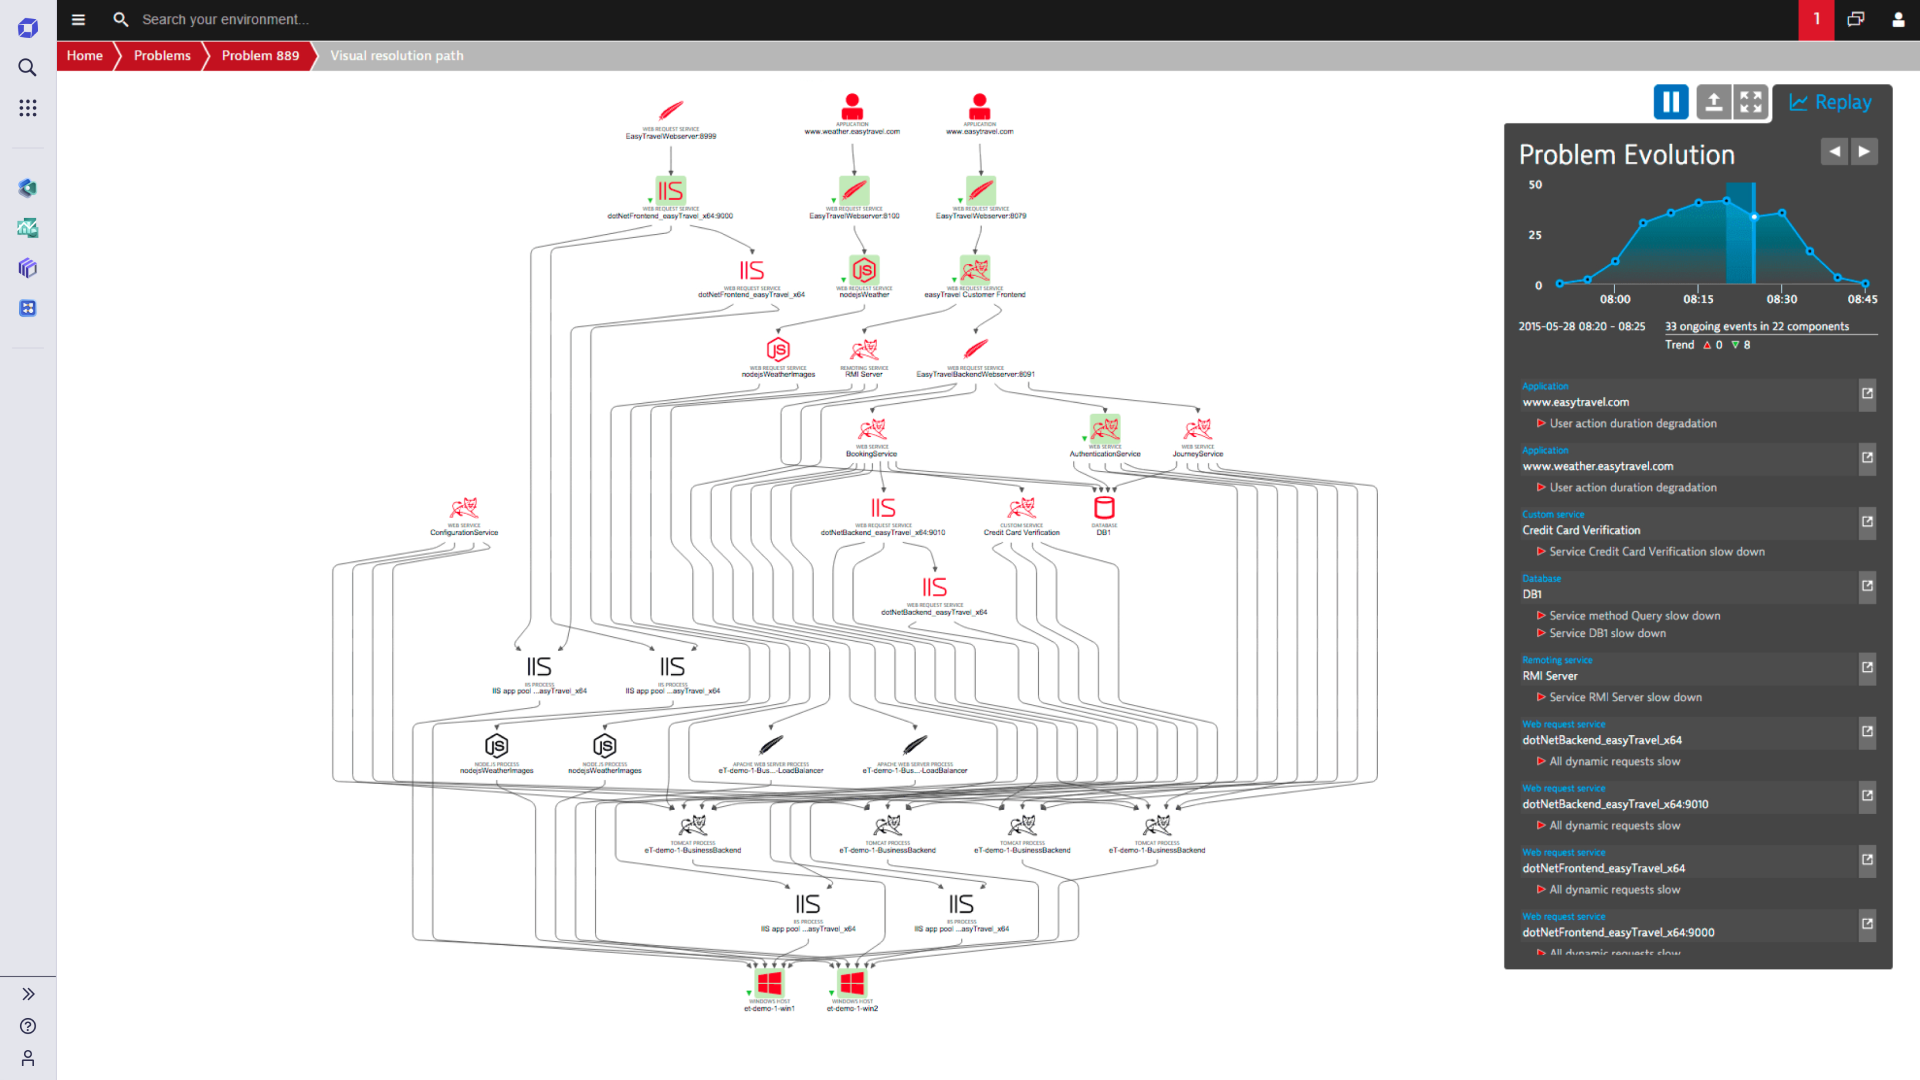
Discover service dependencies and streamline container co-location
Optimize the configuration of Marathon applications groups with new insights into cross-service communication. Dynatrace identifies related containers and automatically visualizes all dependencies throughout your entire application environment.
- Self-learning capabilities automatically discover your application environment end-to-end without configuration.
- All services and hosts are automatically visualized in an interactive topology map.
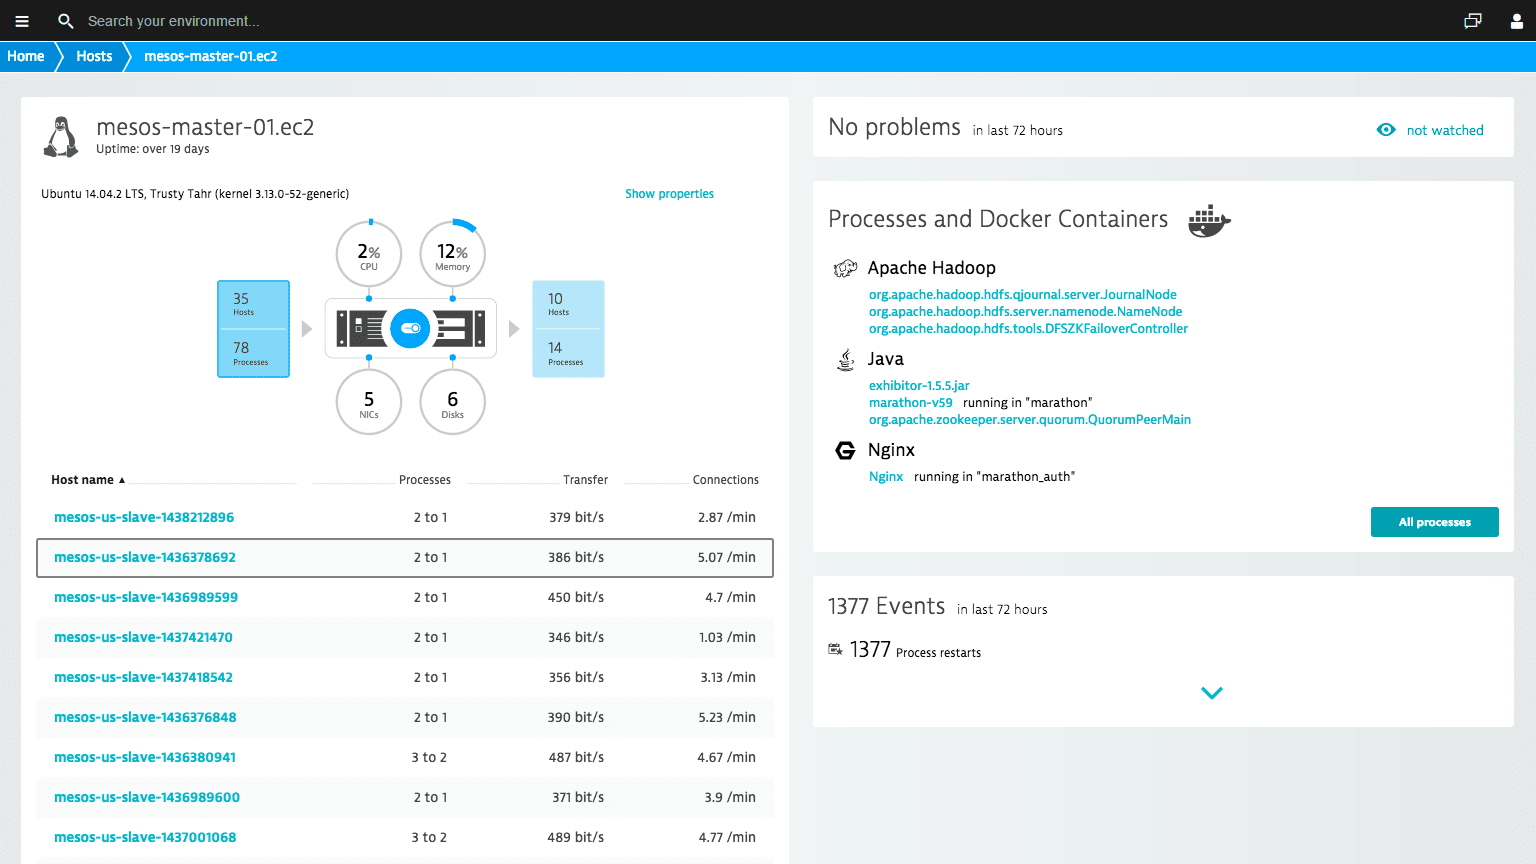
Optimize container resource management
Dynatrace provides deep visibility into cluster metrics and deployed applications.
- Cluster node metrics like CPU, memory, disk latency, and network traffic are available out-of-the-box.
- Containers and applications are automatically detected and monitored.
Try it free


