Nginx monitoring
Monitor your Nginx server performance.
What is Nginx?
Nginx [pronounced "Engine X"] is an HTTP and reverse proxy server that emphasizes high concurrency, performance, and low memory usage. Nginx can also act as a mail proxy server and a generic TCP proxy server. Nginx is available as open source and in a commercial version (Nginx Plus). Nginx is included in the LEMP stack.
As Nginx is a high-speed, lightweight HTTP server engine, more and more web sites and applications are moving to Nginx. According to W3Techs, over 25 percent of all known web servers use Nginx. The performance improvements for serving static content can be significant. Especially at high loads, Nginx is faster than other solutions and consumes less server resources.
Learn more in the Dynatrace APM Blog.
Monitor your Nginx server performance
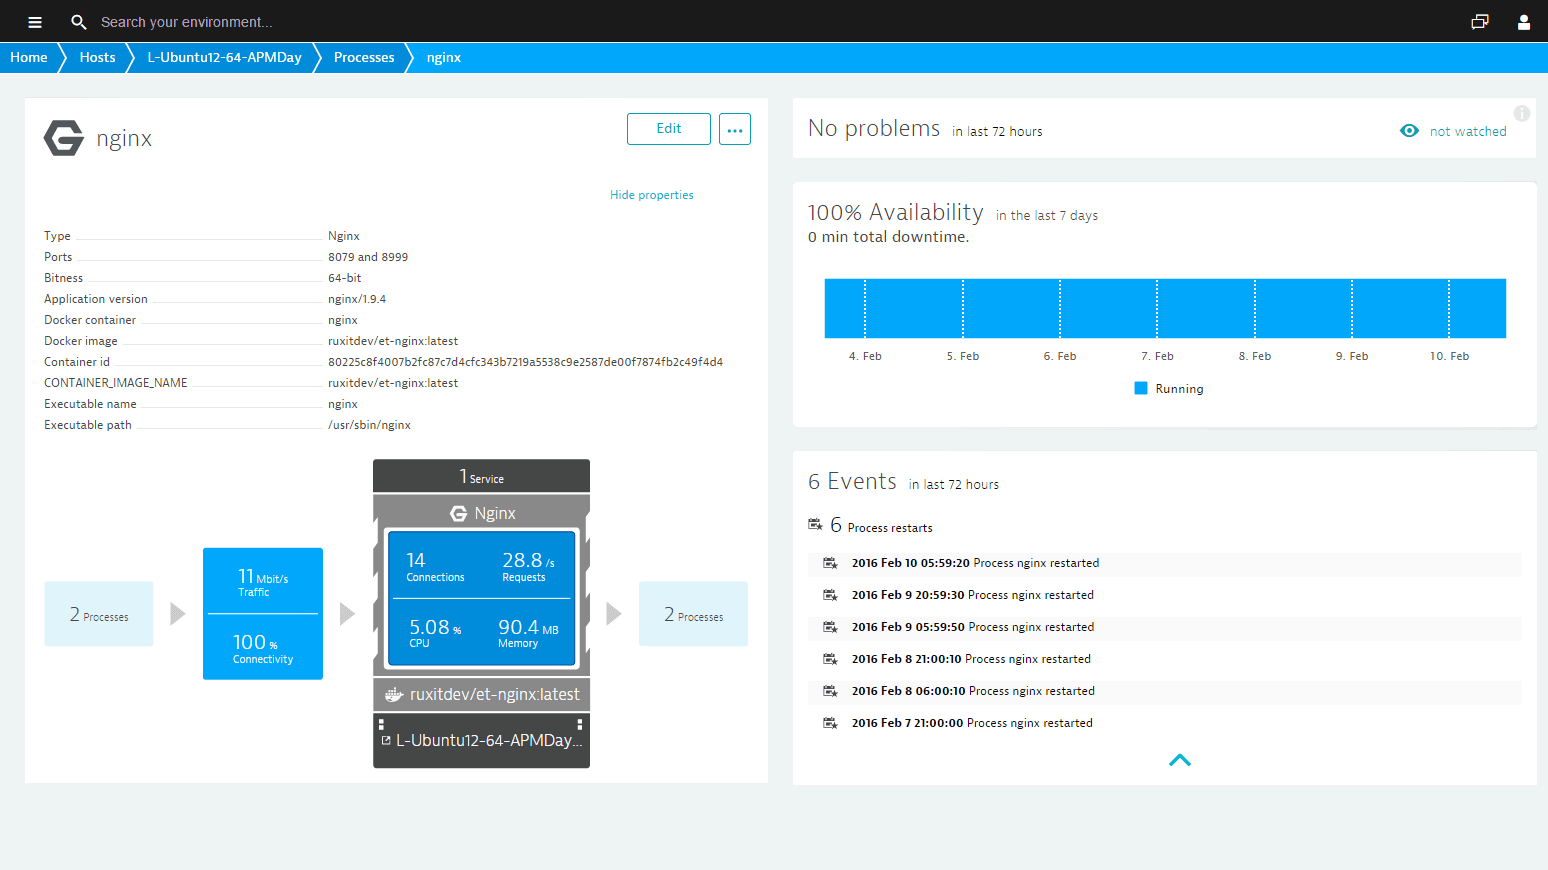
With Dynatrace you get deep-level visibility into each of your web server process groups, including dependent applications and running services. When problems are detected, the Dynatrace anomaly-detection engine correlates host and network metrics with web-server specific metrics like busy workers, active/dropped connections, and number of requests to identify the root causes.
Dynatrace shows you all relevant information in an interactive infographic. Meta information like application version, executable path, and used ports are included. See availability metrics and events like deployment changes and Nginx restarts.
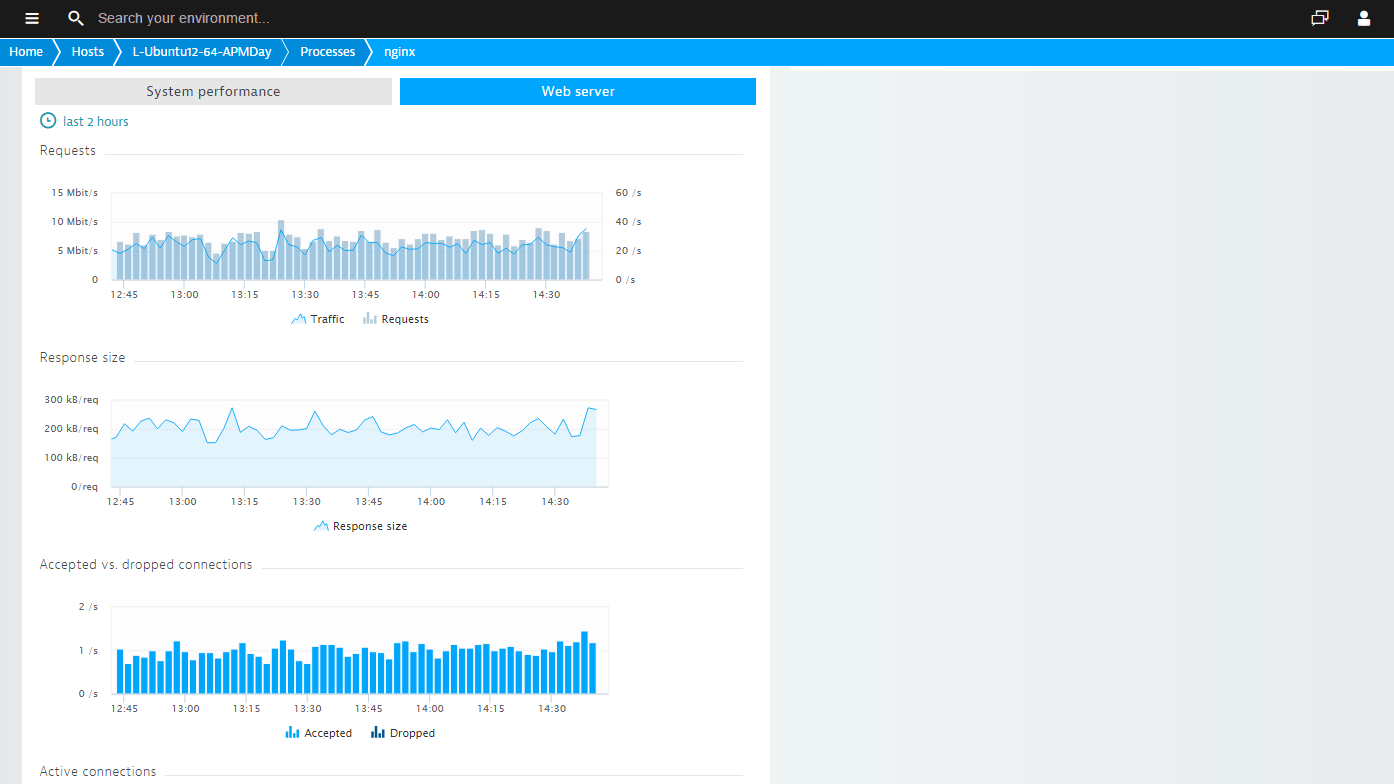
See Nginx-specific metrics (without plugins!)
Just install Dynatrace OneAgent to see the metrics you need. For Nginx, Dynatrace shows you:
- Requests
- Response sizes
- Accepted vs. dropped connections
- Active connections
System performance metrics (CPU, memory, and more) are also available.
You get details about network traffic, TCP requests, and connectivity, along with quality metrics like retransmissions, round-trip time, and throughput.
Discover Nginx Plus metrics
Nginx Plus provides additional functionality for monitoring data. With Nginx Plus, Dynatrace shows you:
- Server zones
- Traffic and requests per server zone
- Upstreams
- Traffic and requests
- Upstream health
- Caches
- Cache performance
- Cache usage
Just click the Nginx Plus and Further details tabs on your Nginx Plus processes to see these metrics.

Start Nginx performance monitoring in under 5 minutes with our free trial!

Analyze response-time hotspots down to the module level
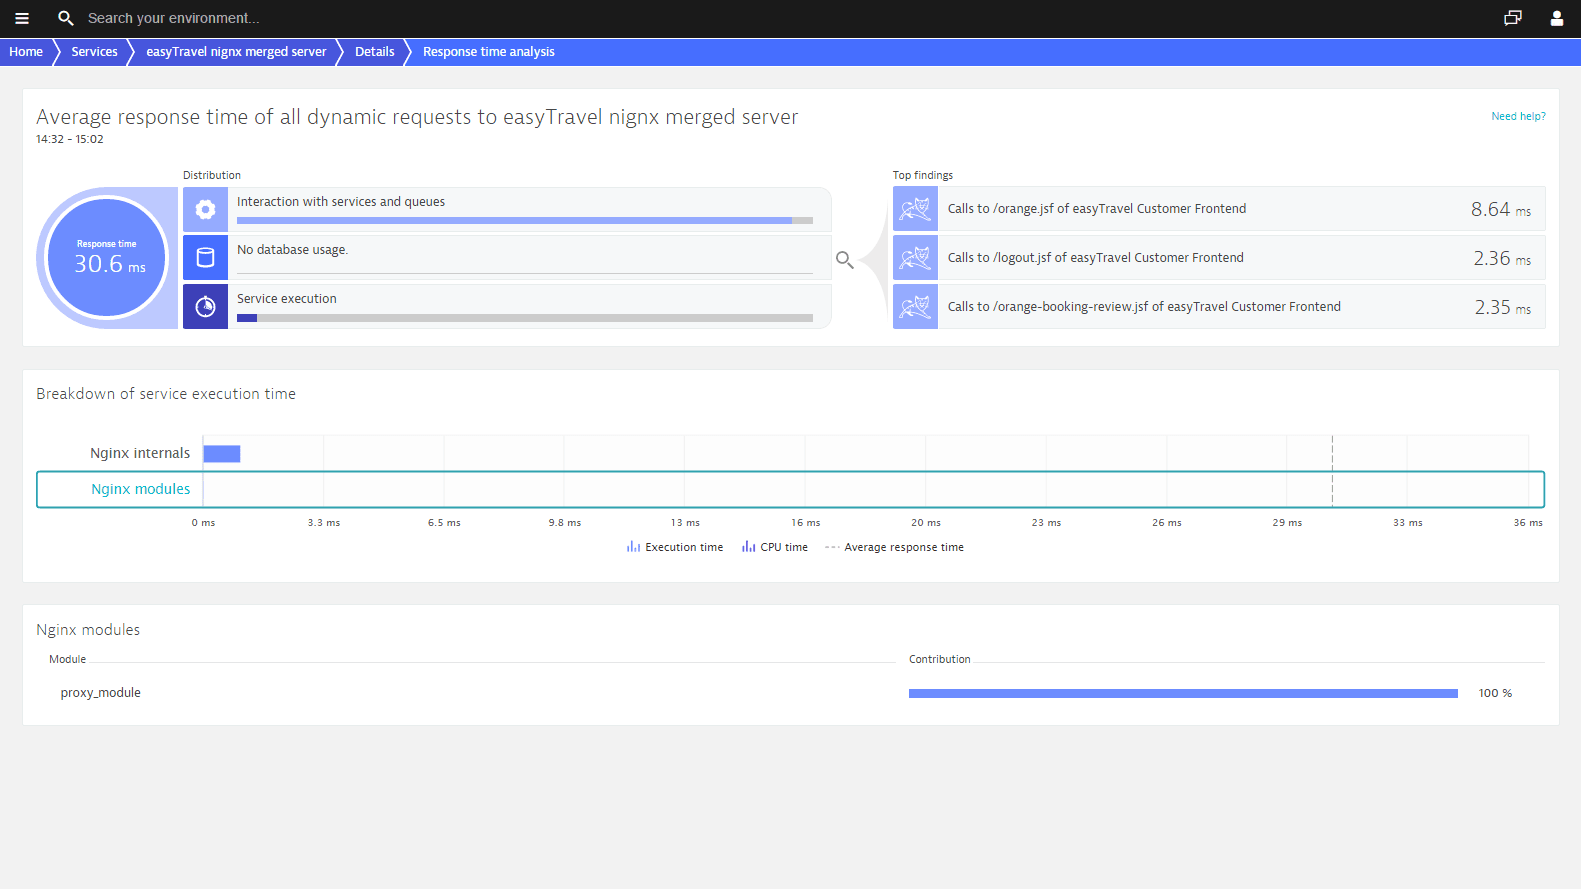
With deep process monitoring enabled, Dynatrace analyzes the response time of each Nginx service running within each process. Each service page enables you to analyze response time hotspots so you can see what activities are consuming the most time for each service.
On the Response time analysis page you see the average response time observed during the analyzed time frame. The infographic also shows how much time is contributed by Nginx internals and Nginx modules.
Auto-detect your application environment!
Dynatrace full stack monitoring extends web server monitoring beyond basic status metrics. With a single agent installed on your server, Dynatrace auto-detects all Nginx web servers in your application architecture. See the full picture of your application topology and identify dependencies between tiers in your application stack.
CPU saturation slowing down your database, your services, and your website? You'll receive a single notification that addresses the root cause of the problem, not multiple alerts that you need to sort through and analyze. Using artificial intelligence, Dynatrace detects performance anomalies before they affect customer experience.
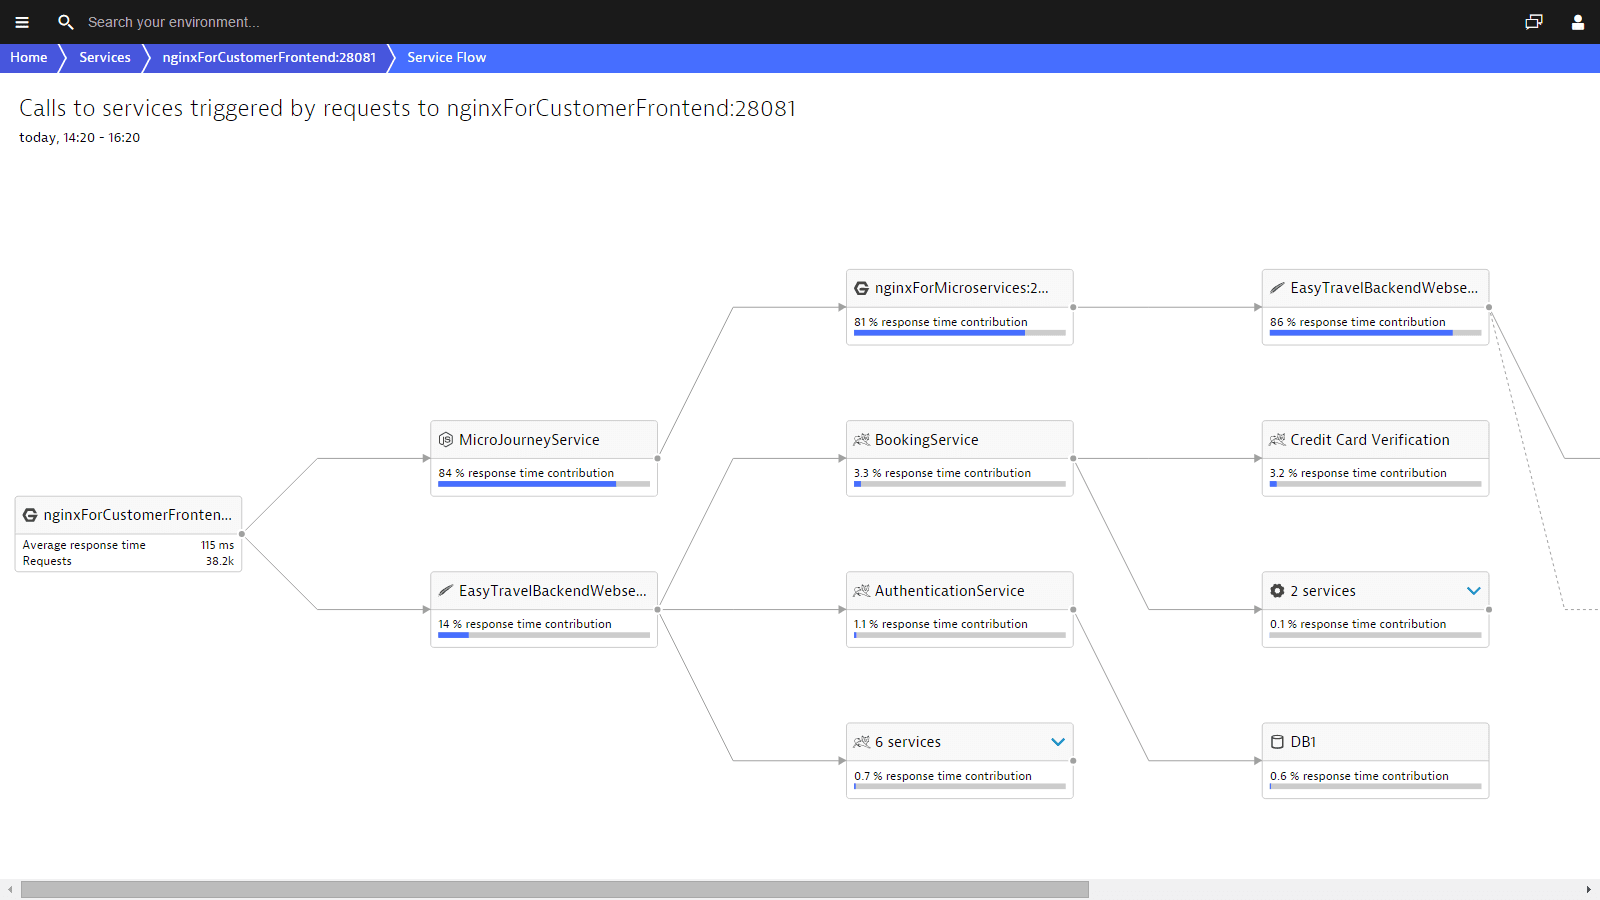
Visualize Nginx service requests end-to-end
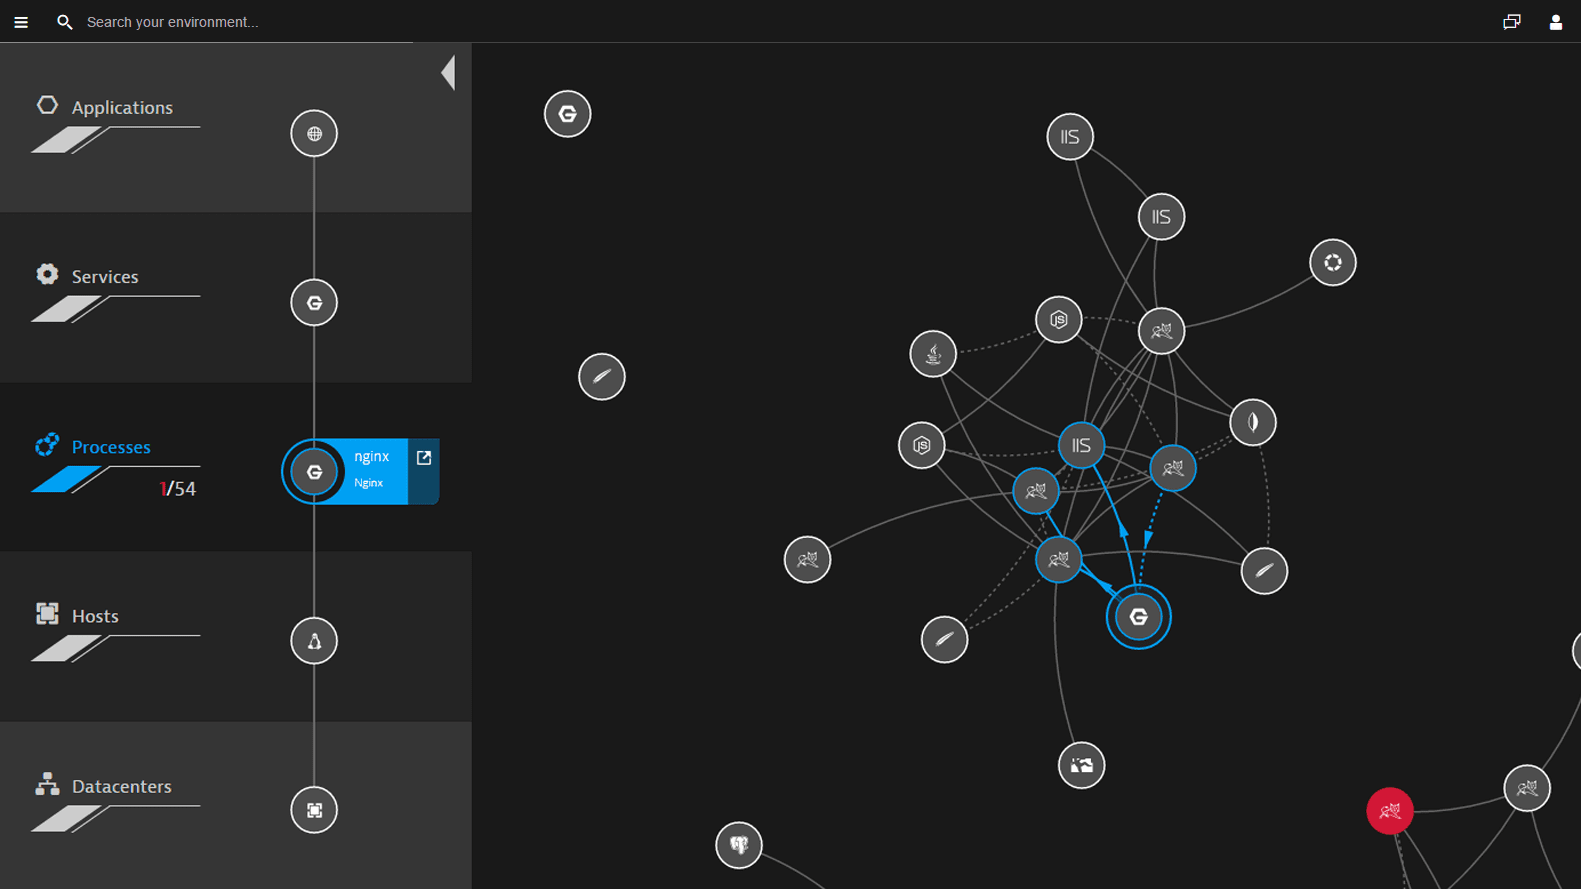
Dynatrace understands your applications’ transactions from end-to-end. Service flow shows the actual execution of each individual service and service-request type. While Smartscape shows you your overall environment topology, service flow provides you with the view point of a single service or service-request type.
The screenshot shows what a web request of an Nginx service triggers in the system and how each component contributes to the overall response time. As you can see, this perspective provides far more detail than Smartscape view. This degree of analysis enables you to understand the bigger complexities within your system.
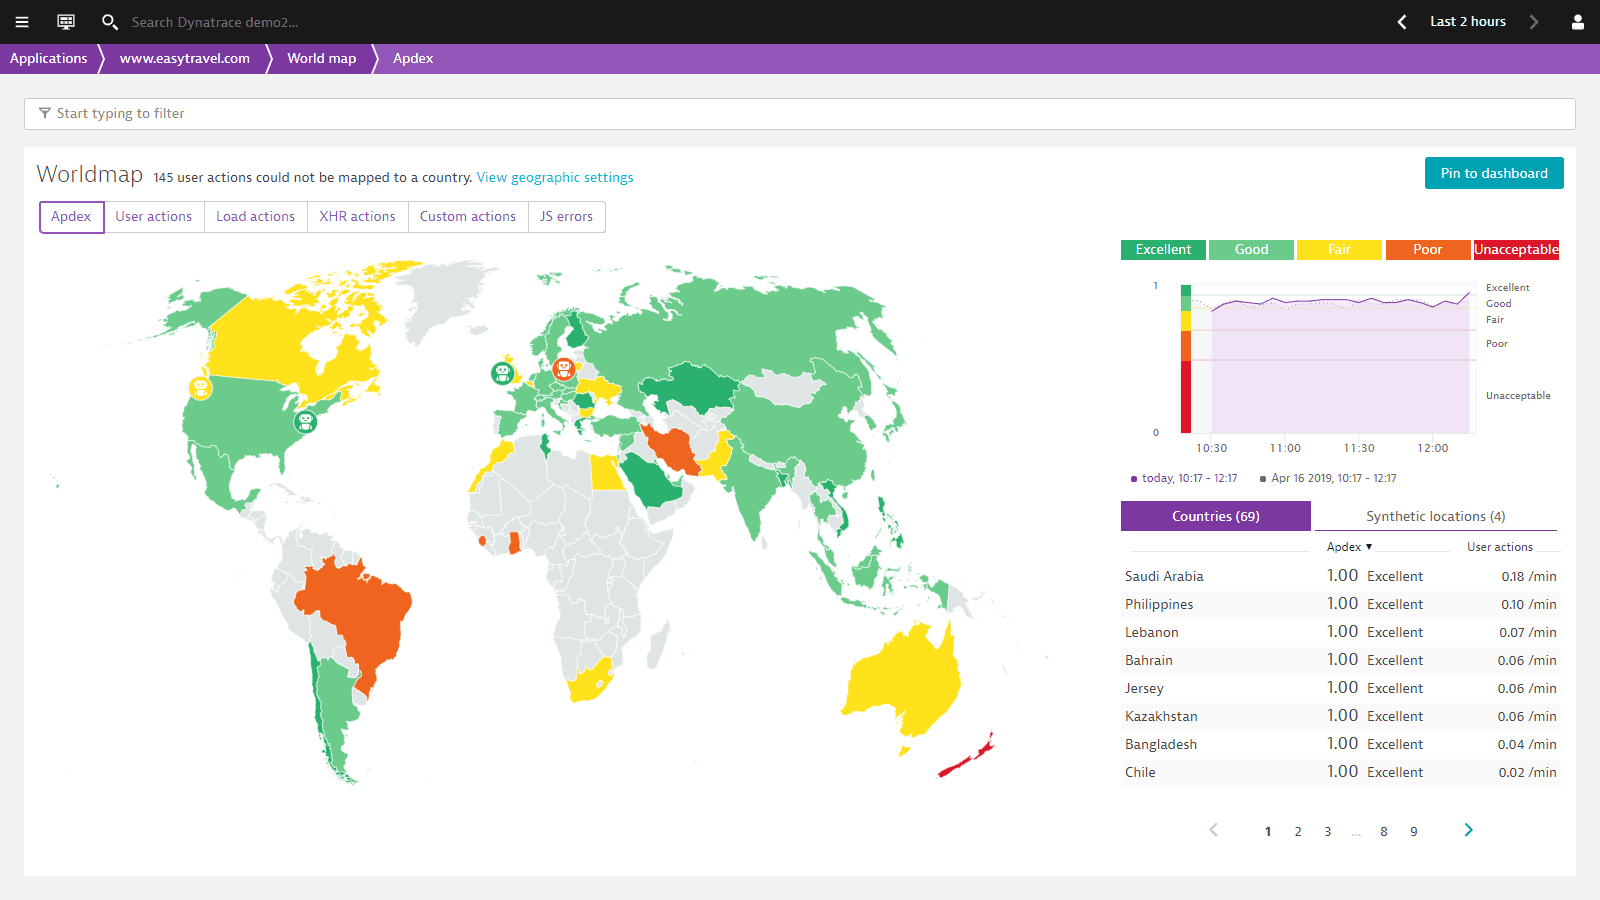
Monitor real user performance without code changes
Dynatrace real user monitoring (RUM) collects metrics from your customers' web browsers and correlates it with server-side information obtained from Dynatrace OneAgent. Web browser data is collected by a JavaScript tag that is placed inside the HTML of your applications' web pages.
Dynatrace OneAgent JavaScript tag injection is performed automatically during installation. All you need to do to initiate injection is to restart your Nginx processes following Dynatrace OneAgent installation. Dynatrace OneAgent identifies HTML content responses and automatically injects a small JavaScript tag into the head section of each page.
Dynatrace seamlessly integrates real user monitoring and synthetic monitoring:
- Analyze response times and resolve JavaScript issues by seeing your website as your customers do!
- Monitor the availability and performance of your web applications by recording synthetic monitoring using a simple point-and-click interface.

Dynatrace was installed within a day and we immediately saw value with issues identified that needed to be addressed, including one in a high value channel that was impacting performance for customers.

Try it free

