
Web check analysis just got even better. Following the recent introduction of user-action waterfall analysis and JavaScript error analysis into Dynatrace real user monitoring, we’ve now made both features additionally available for web checks.
Web checks are synthetic user visits that monitor the availability of a URL or any number of business-critical transactions in your environment 24/7. At Dynatrace, we’re convinced that synthetic monitoring (i.e., “web checks”) and real user monitoring are most effective when they’re used in combination with one another. This is why both Dynatrace real user monitoring and Dynatrace web checks are built on top of common technology that enables easy comparison of monitoring results when you need it.
Waterfall analysis findings for web checks
To drill down to the waterfall finding of a specific web check execution
- Select Web checks & availability from the navigation menu.
- Select a web check.
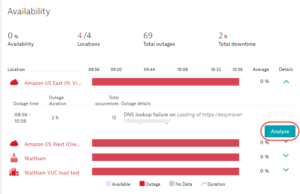
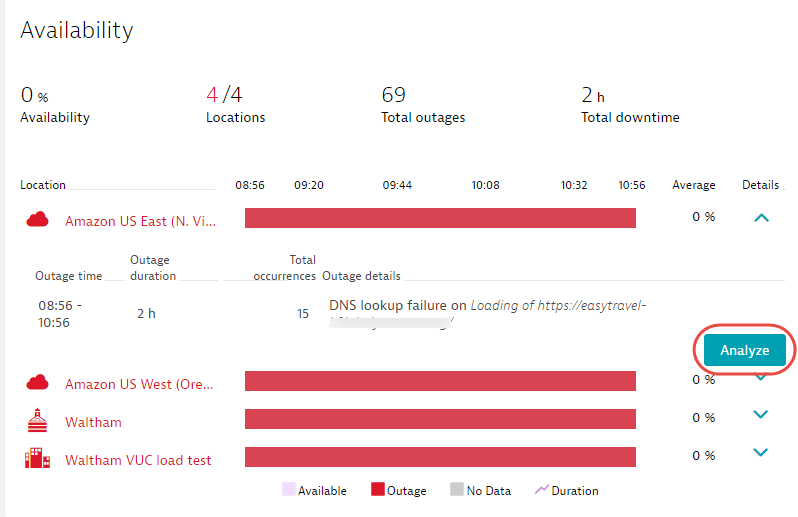
- Expand the Details of one of the monitoring locations and click the Analyze button to open Web check analysis view.
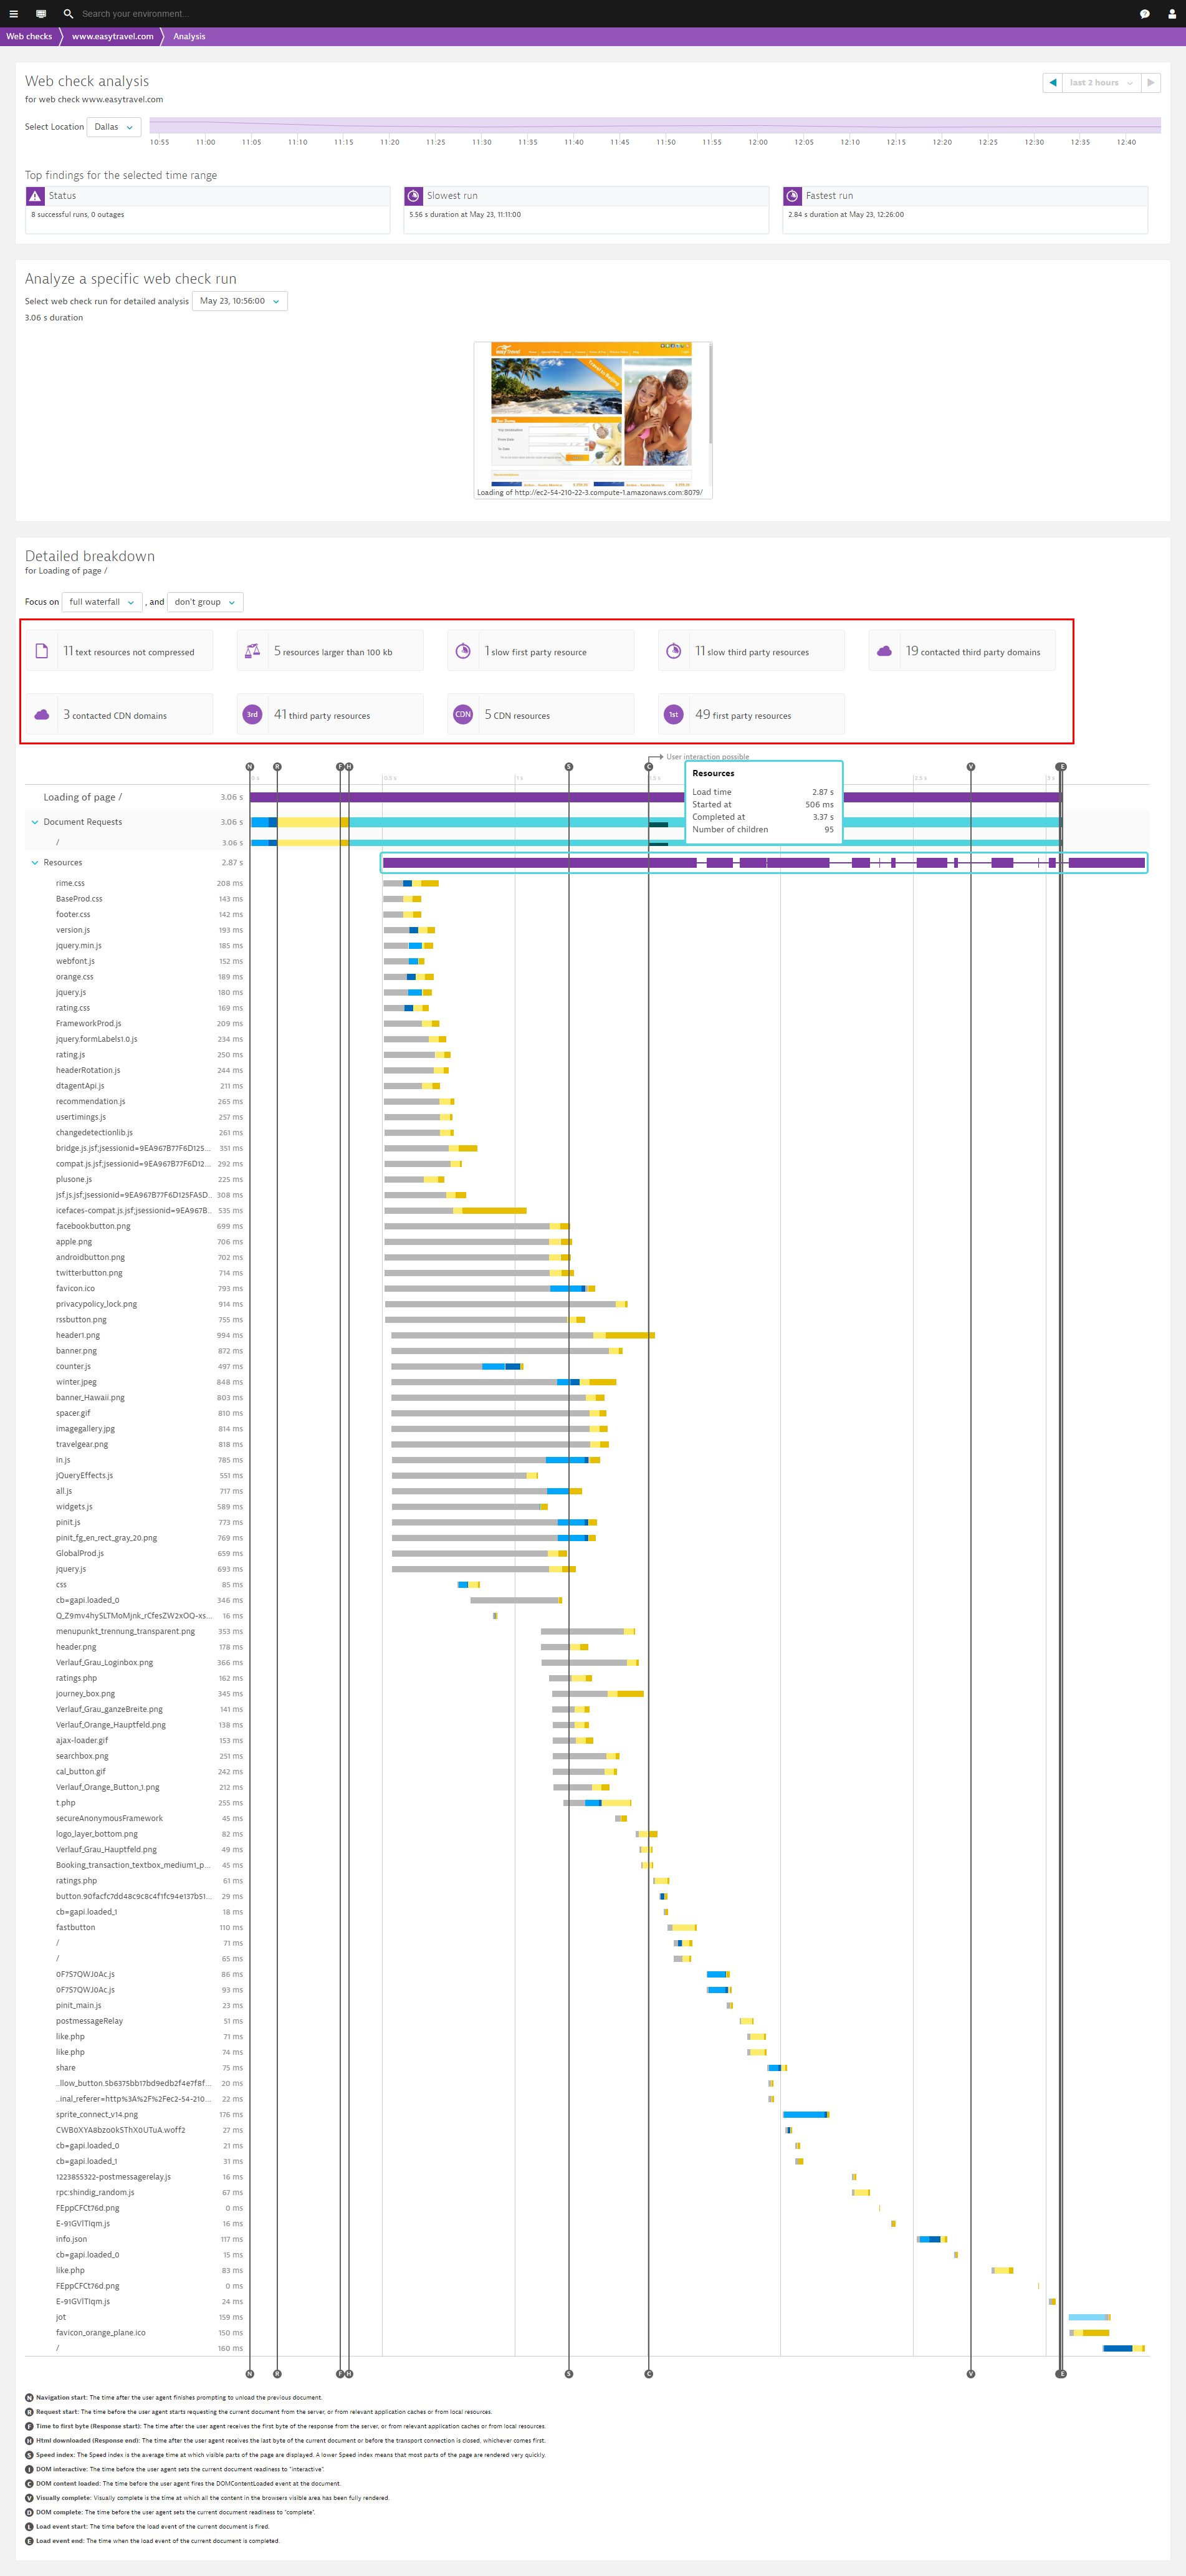
- From the Analyze a specific web check run drop list, select the web check run you’re interested in.
- You’ll find the waterfall findings for the selected run in the Detailed breakdown section of the page (see example below). These findings help you quickly identify potential problems with your application, such as uncompressed resources and slow 3rd party providers. For a detailed list of available findings, please have at our recent user-action waterfall analysis blog post.
- Click one of the findings at the top of the waterfall analysis to highlight the related Resources in the waterfall.
Note: Resource timings can now be grouped by domain.
JavaScript error analysis for web checks
You can now also analyze the details of JavaScript errors that are detected during Web check runs. JavaScript errors appear as red markers in the waterfall timeline at the point in time they occurred during the run (see example below). Simply click a marker to analyze the details of that error (see the next example further down this page).
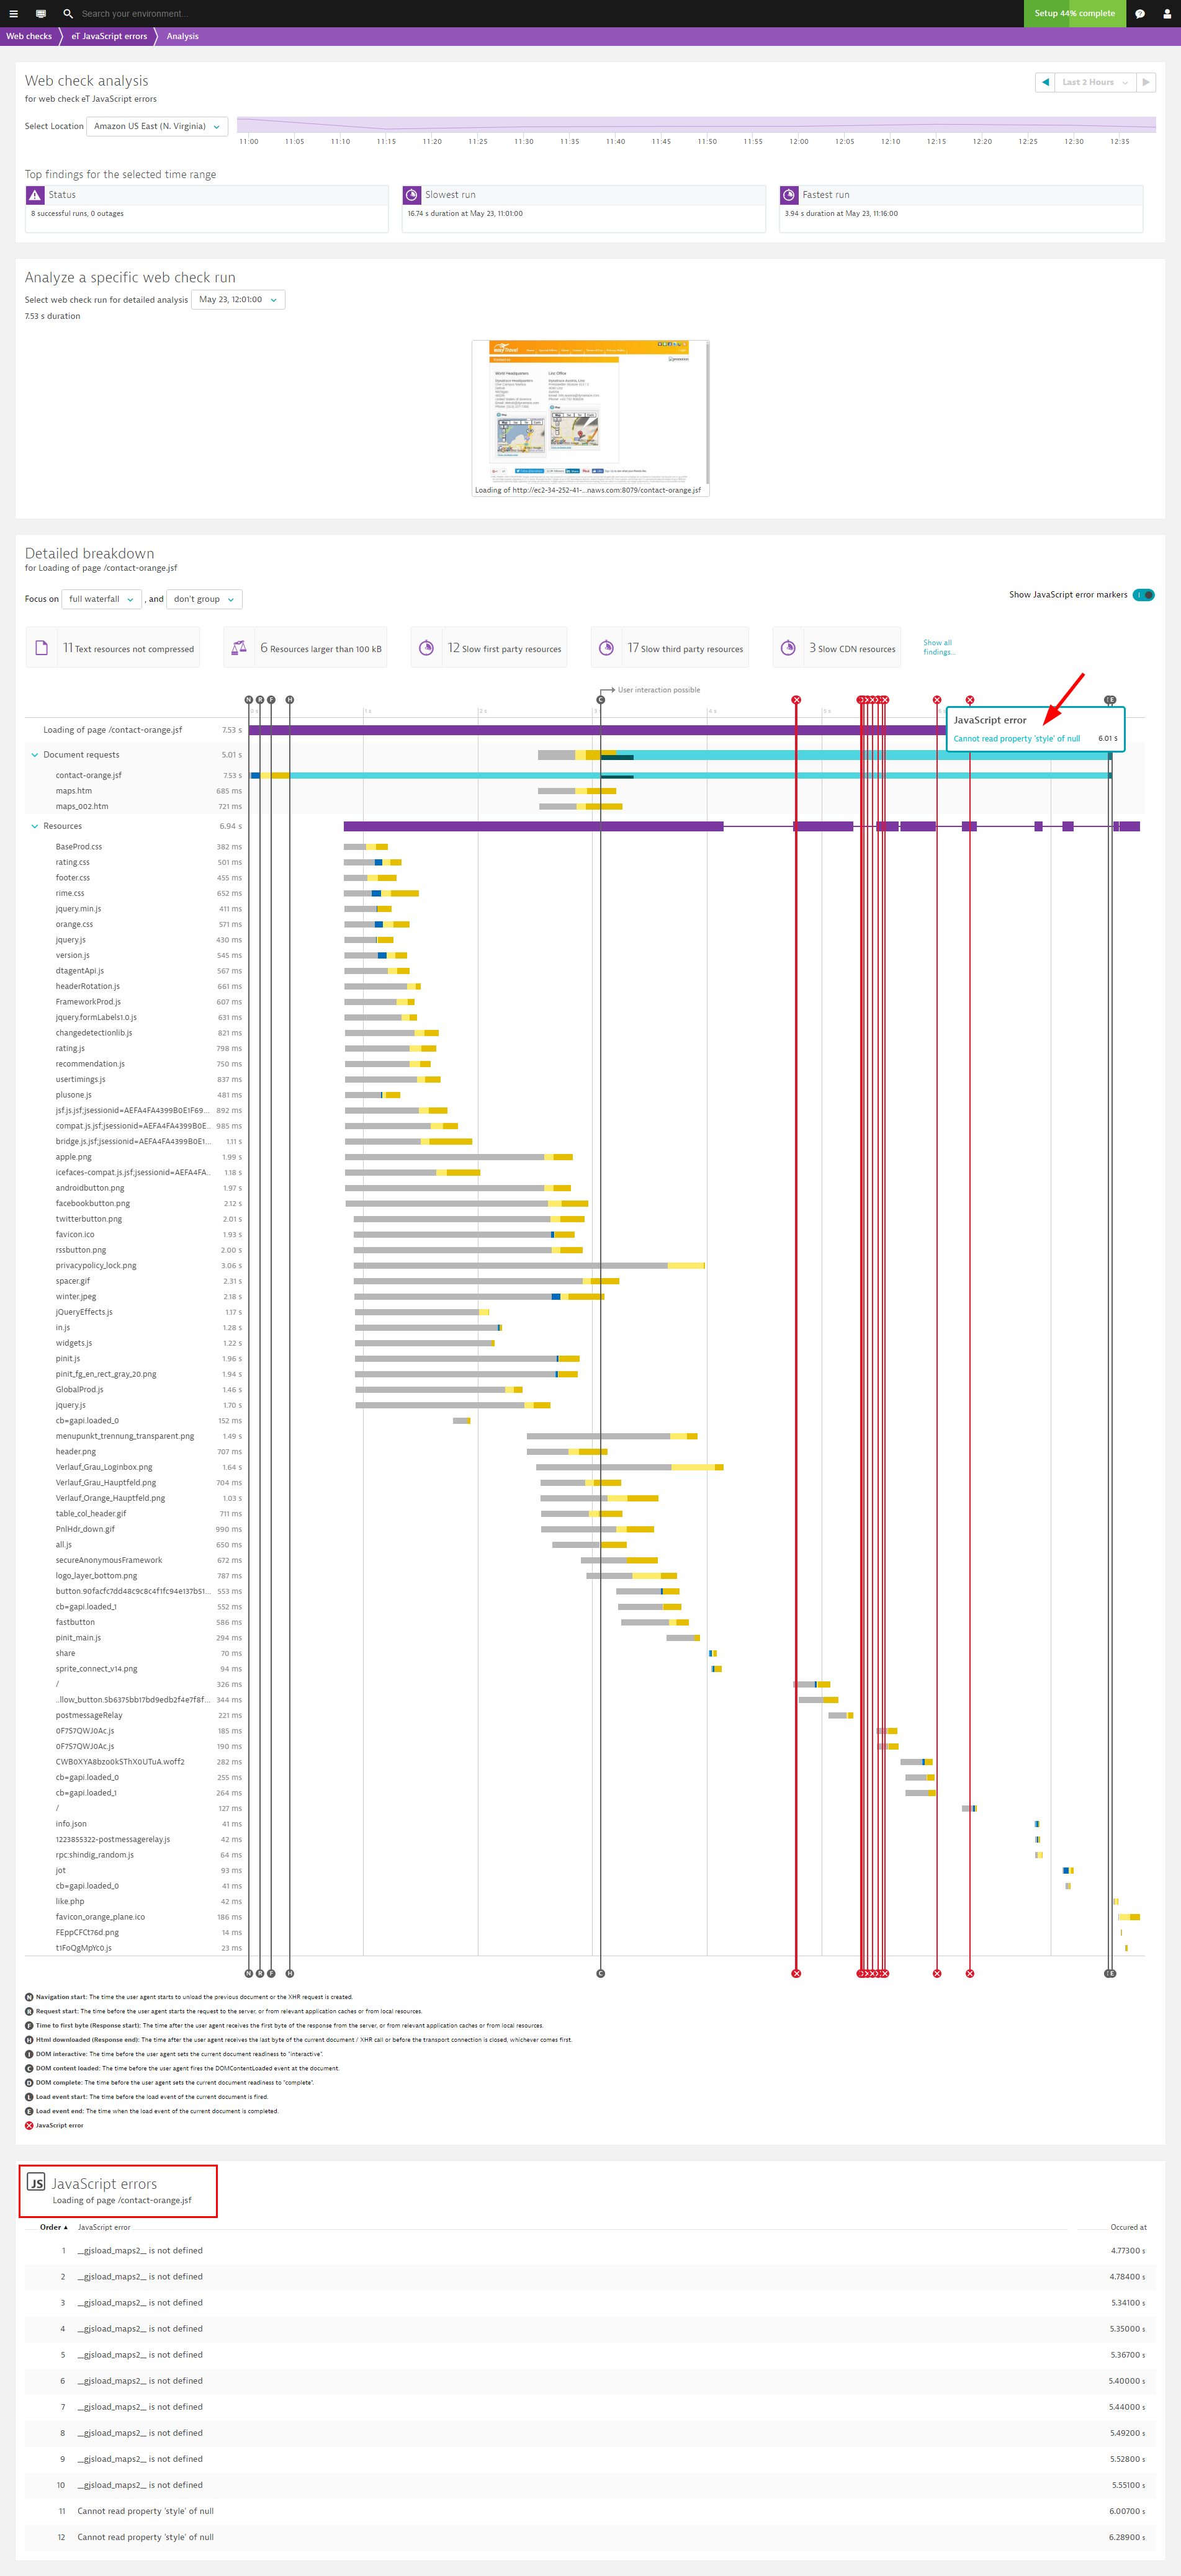
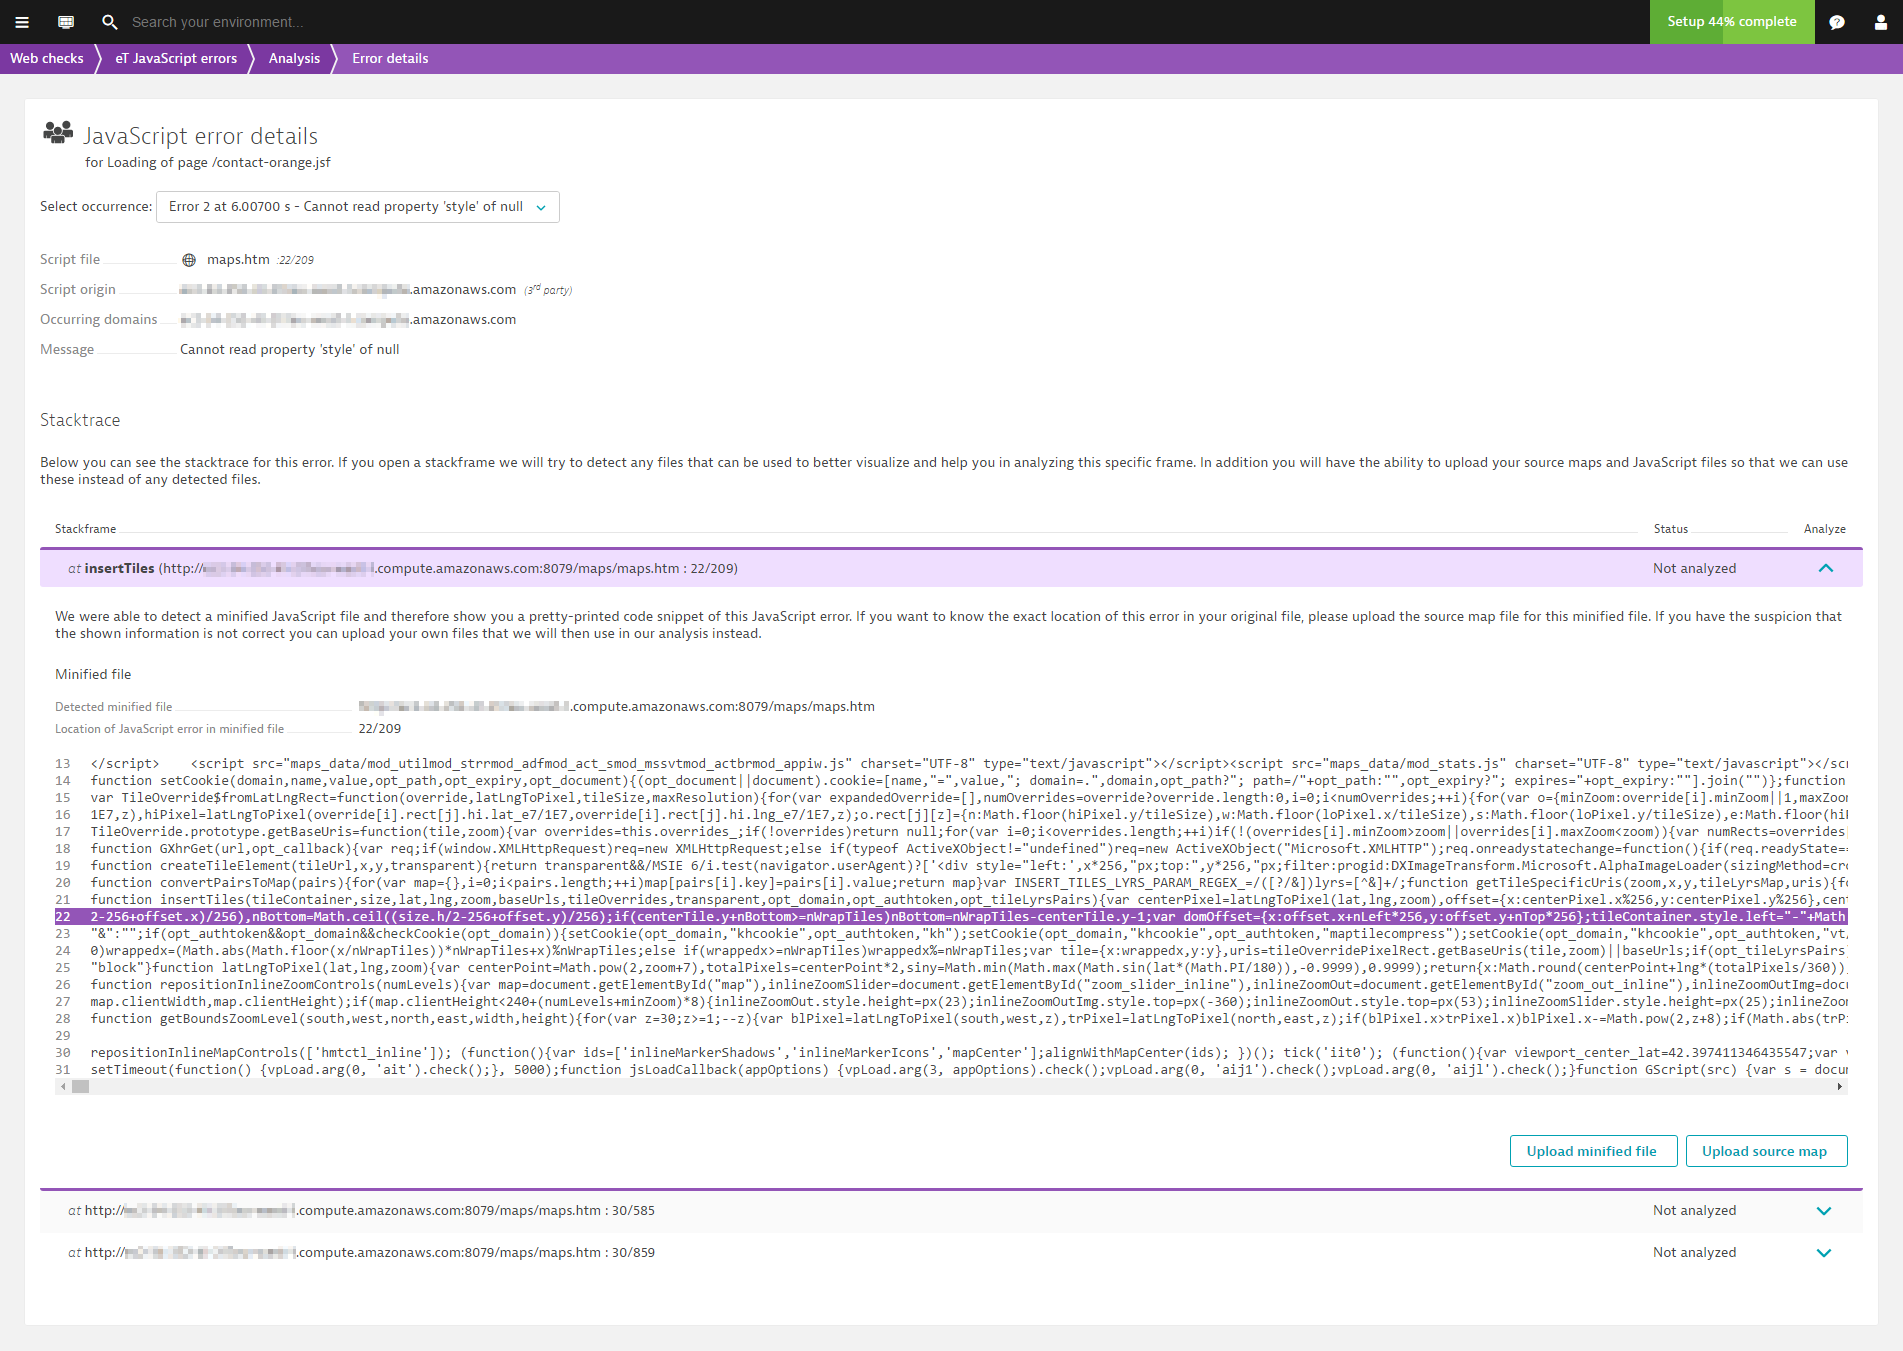
The Error details page for each detected JavaScript error includes a complete stacktrace that identifies the exact line of code that’s responsible for the error. This insight can dramatically accelerate the time it takes to resolve such errors.
To learn more about the JavaScript error analysis capabilities of Dynatrace, please see the blog post Source map support for JavaScript error analysis.


Looking for answers?
Start a new discussion or ask for help in our Q&A forum.
Go to forum