
A long awaited Dynatrace feature—the ability to view the history of detected problems in your environment within custom time frames—is finally here!
To date, the Problems feed and the Problems dashboard tile have provided a rolling 72-hour history of open/closed problems in your environment. We selected 72 hours as the default time frame because this gives DevOps teams adequate time to analyze detected problems, even when they occur on weekends. As always, quick response to detected problems is considered best practice. However, there are instances when custom time frame analysis of detected problems can be valuable.
Time frame selector for problems history
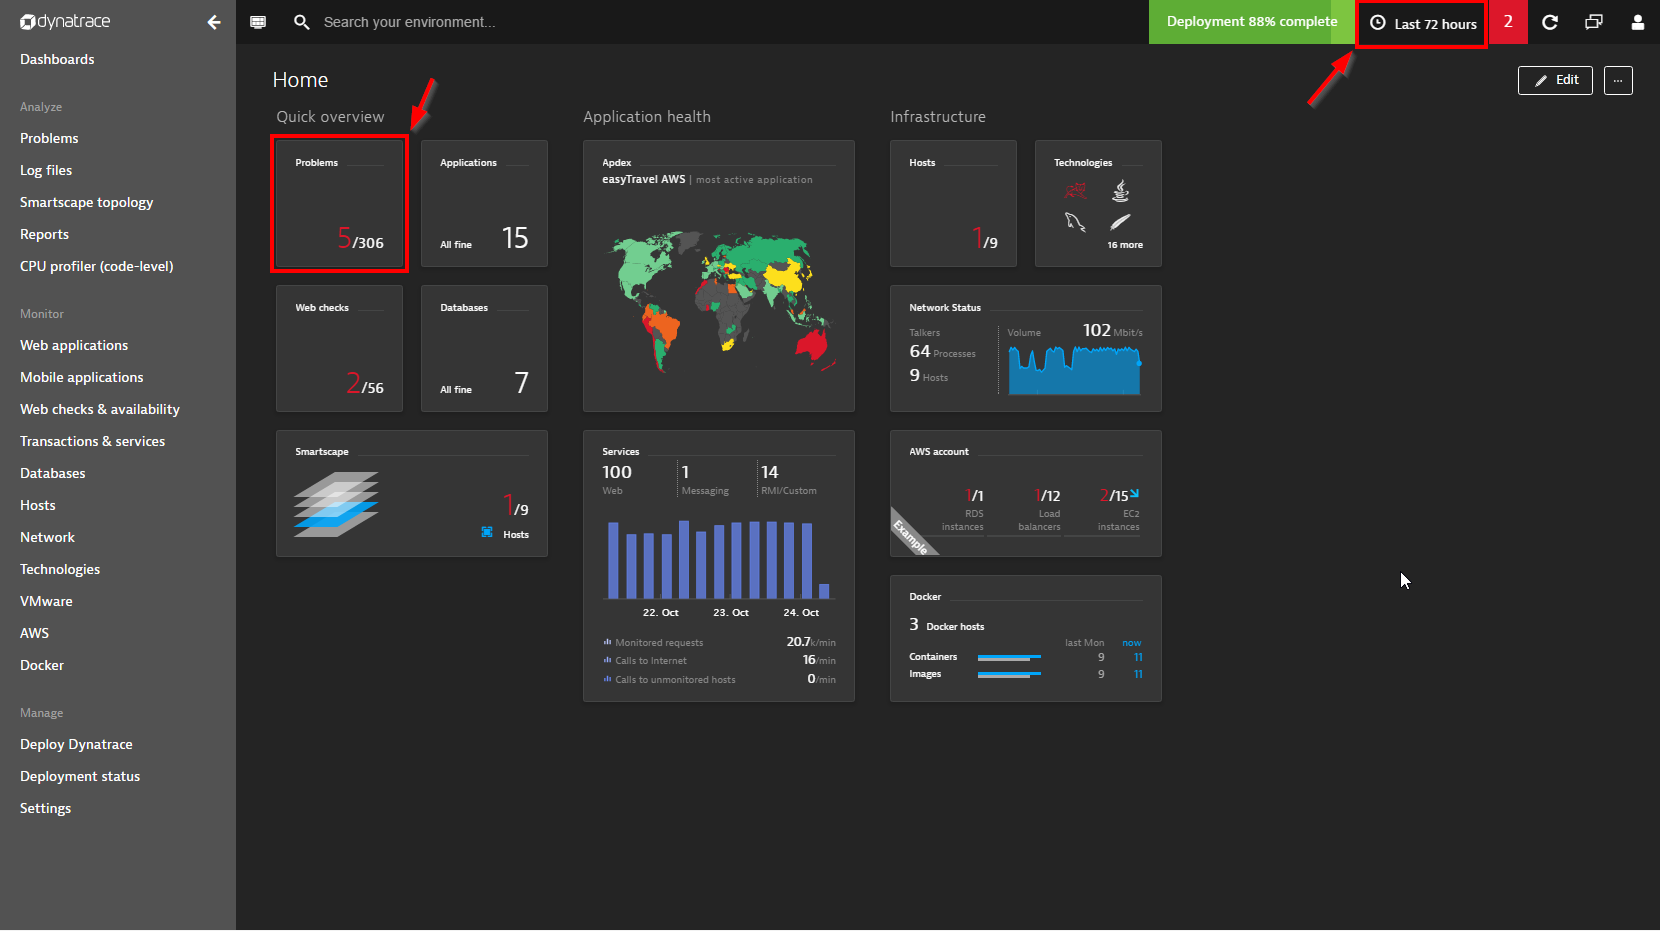
Using the Time frame selector in the Dynatrace menu bar, it’s now possible to select a custom period of time for problem history analysis, both within your Problems feed and o your Problems dashboard tile. As you can see in the example below, the Problems tile includes the count of open problems against the total number of closed problems detected within the Last 72 hours. In this example, 306 problems were detected and resolved during the selected time frame while 5 problems remain open. By clicking the Time frame selector in the menu bar, it’s easy to select an alternative time frame for analysis. Also, note the Alerts indicator in the menu bar. In this example, the Alerts indicator shows that 2 problem alerts were sent out during the selected time frame. Alert levels vary based on your watch settings for different problem categories (applications, services, or infrastructure).
Time frame selector for Problems feed
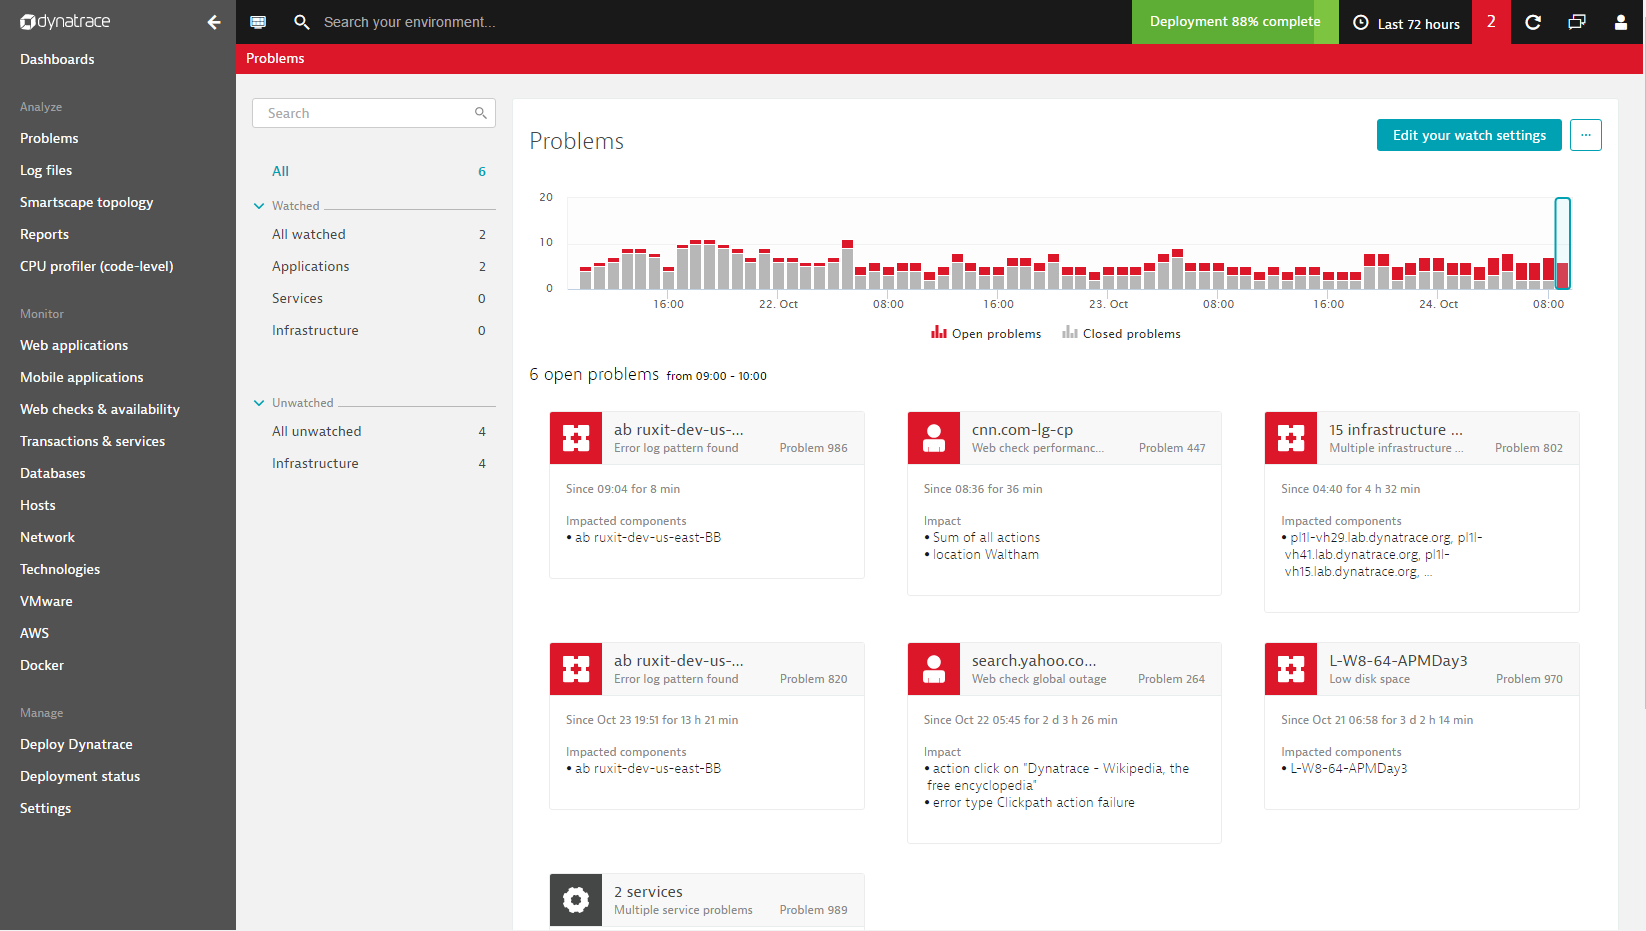
Select Problems from the navigation menu to access your Problems feed (or click the Problems tile on your dashboard). The open/closed problems timeline chart now reflects your selection in the Time frame selector (see example below). In this example, you can see that there are 6 open problems.
Because it’s often not feasible to display all problems that were detected during time frames longer than 72 hours, the Problems feed displays open/closed problems only for specific time intervals within the selected time frame. In the example below, the feed shows only those open/closed problems that were detected between 09:00 – 10:00 am. You can select any time interval within the selected time frame to drill down into the problem metrics for that time period. This approach only applies to time frames of 72 hours or longer.
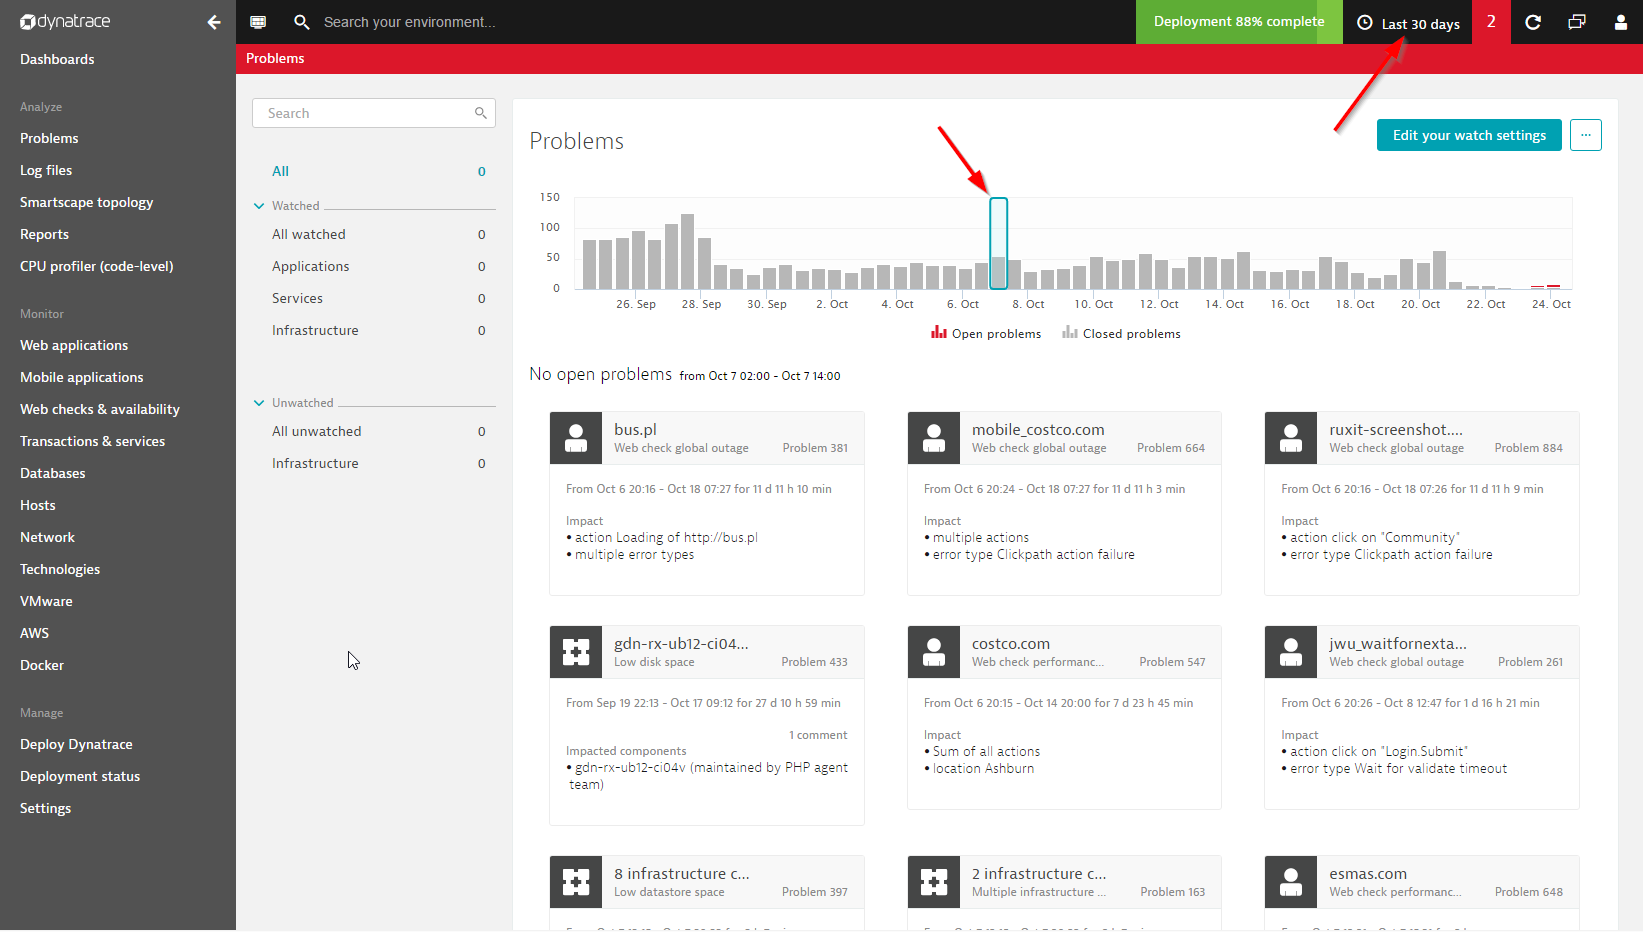
By changing the Time frame selector setting to the Last 30 days, you can view problem-detection statistics for the past month. Here again, you can select individual time intervals for deeper analysis (Oct 7, 02:00 to 14:00 in the example below).
Limitations to transaction storage
There are some limitations when viewing problems that are more than a month old. This is because complete transaction storage is limited to 10 days. This means that you must perform all detailed problem analysis and triage within 10 days of problem detection.
For future reference and problem-trend analysis, Dynatrace provides unlimited retention of time series based metrics which are aggregated over time. This means that the most granular time resolution available for viewing time series based metrics during the first 30 days following problem detection is 1 minute. After 30 days, time resolution falls to a maximum granularity of 5 mins. Thereafter, resolution drops to 15 mins, 1 hour, 1 day, etc.
Also, please note your full problem history appears in your Problems feed 48 hours after you update to the latest version of Dynatrace.


Looking for answers?
Start a new discussion or ask for help in our Q&A forum.
Go to forum