
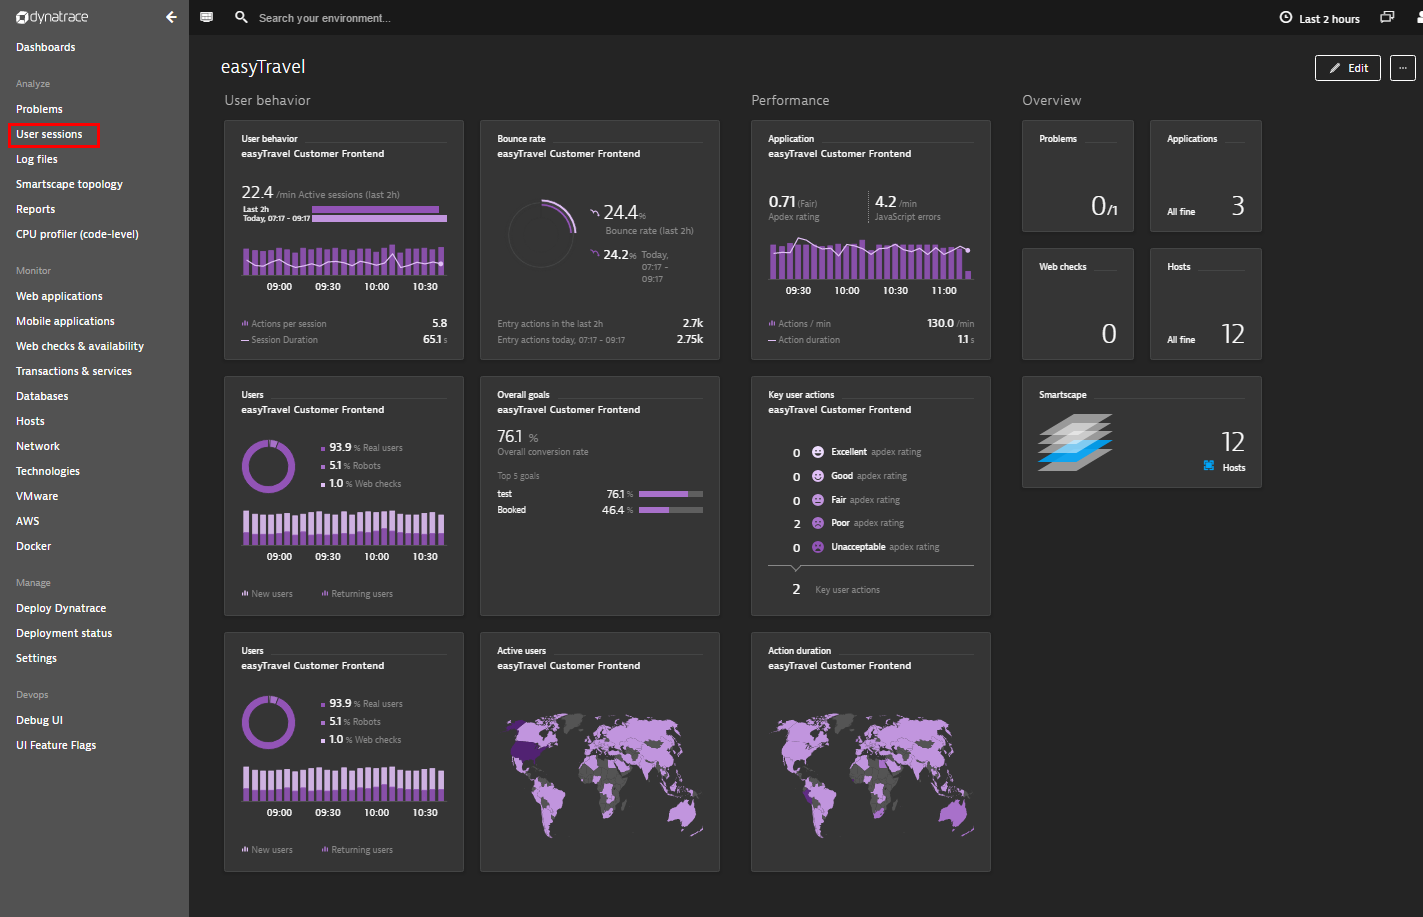
The new User sessions search and analytics view enables you to search for specific users and analyze your user sessions across applications based on specific criteria.
To access User sessions view, click the new User sessions link in the navigation menu.
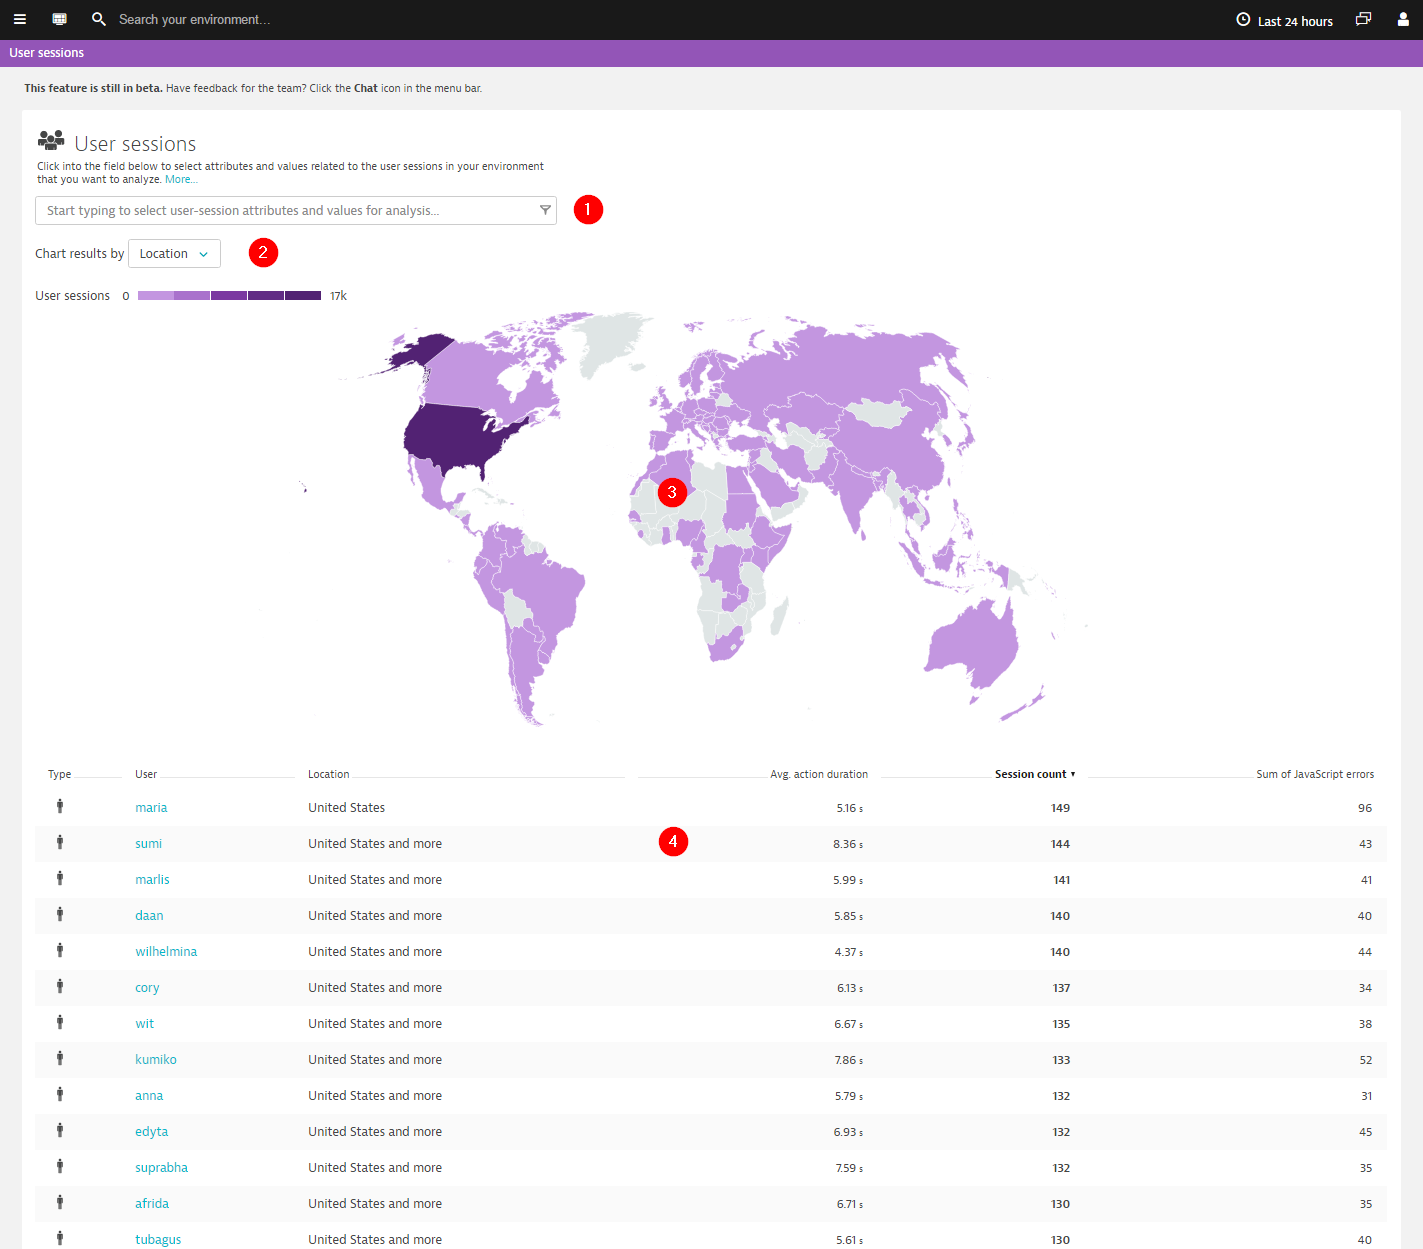
User sessions view (see below) displays your environment’s user distribution on a world map. It also displays your environment’s top users (based on user session count during the selected time frame).
By default (i.e., without filtering), you see a listing of all users and their user sessions across all your applications. The view consists of 4 main sections:
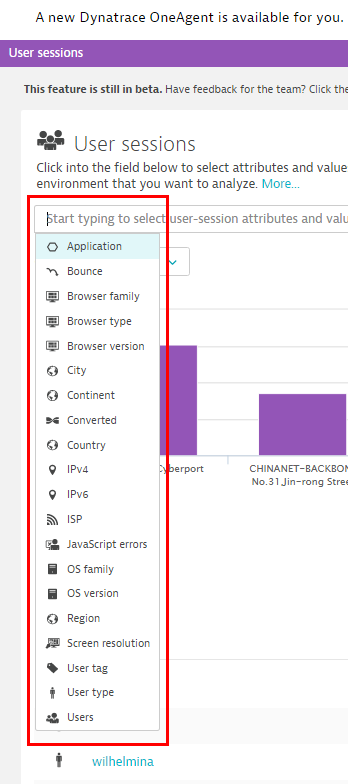
- An input field you use to search for the user sessions of specific users or to filter user sessions based on specific session attributes, such as application, location, or browser.
- The Chart results by drop list provides options for organizing your chart data (Location, ISP, Conversions goals, etc) for all user session data that satisfy the filter criteria and occurred during the analysis time frame.
- A clickable chart that displays your charting results (world map view in the example below).
- Top user list. While the chart displays data for all user sessions, the top users list only shows data for the top 100 users (note that it’s possible to extend this list to show your environment’s top 1,000 users).
Cross-application user behavior analysis
For some time now, it’s been possible to gain an overview of the user profiles that use a specific application. Application-specific user profile detail shows where users are located, which devices and browsers they use to access your application, and the number of bounced visits your application receives. Now, with the new charting functionality available within User sessions view, you can analyze the sessions of individual users across 11 cross-application attributes.
You can compare the number of user sessions by Application, or use the Browser and Browser type charts to identify the most used browsers across all your applications. To better understand the profiles of your users, a world map view shows your users’ Location, operation systems (OS), and Internet service providers (ISP).
To inform your discussions with designers and developers, User sessions view provides insights into Screen resolution types and JavaScript error count distribution across all user sessions. And by comparing Bounce user sessions, Converted users sessions (conversion goals), and new versus returning Users ratios, you will gain a much deeper understanding of your user base.
Additional user profile attributes will be released over the coming weeks to further extend Dynatrace user-session analysis.
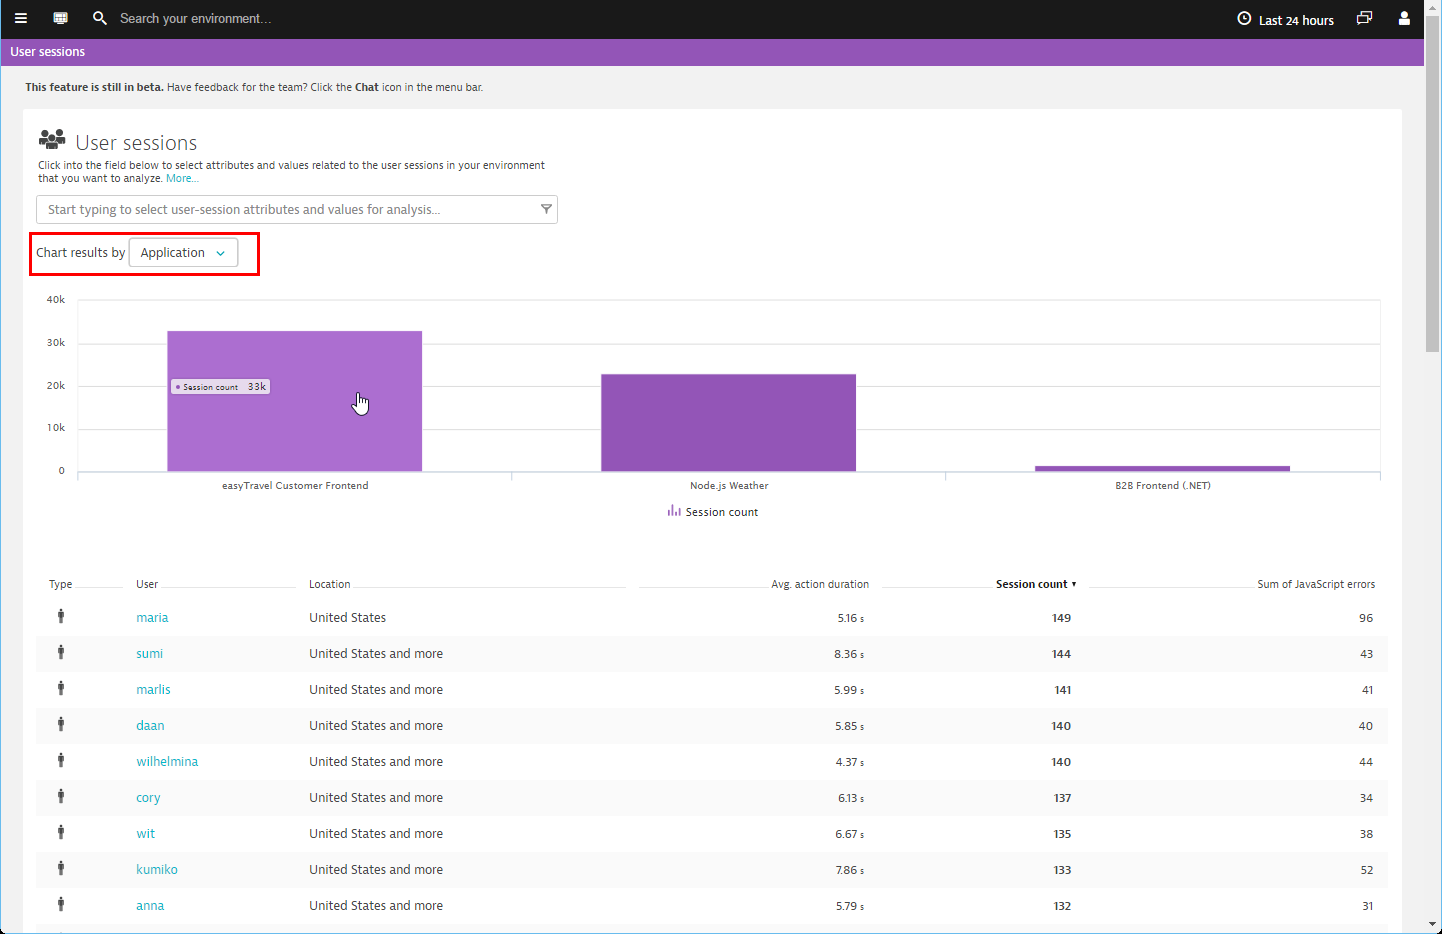
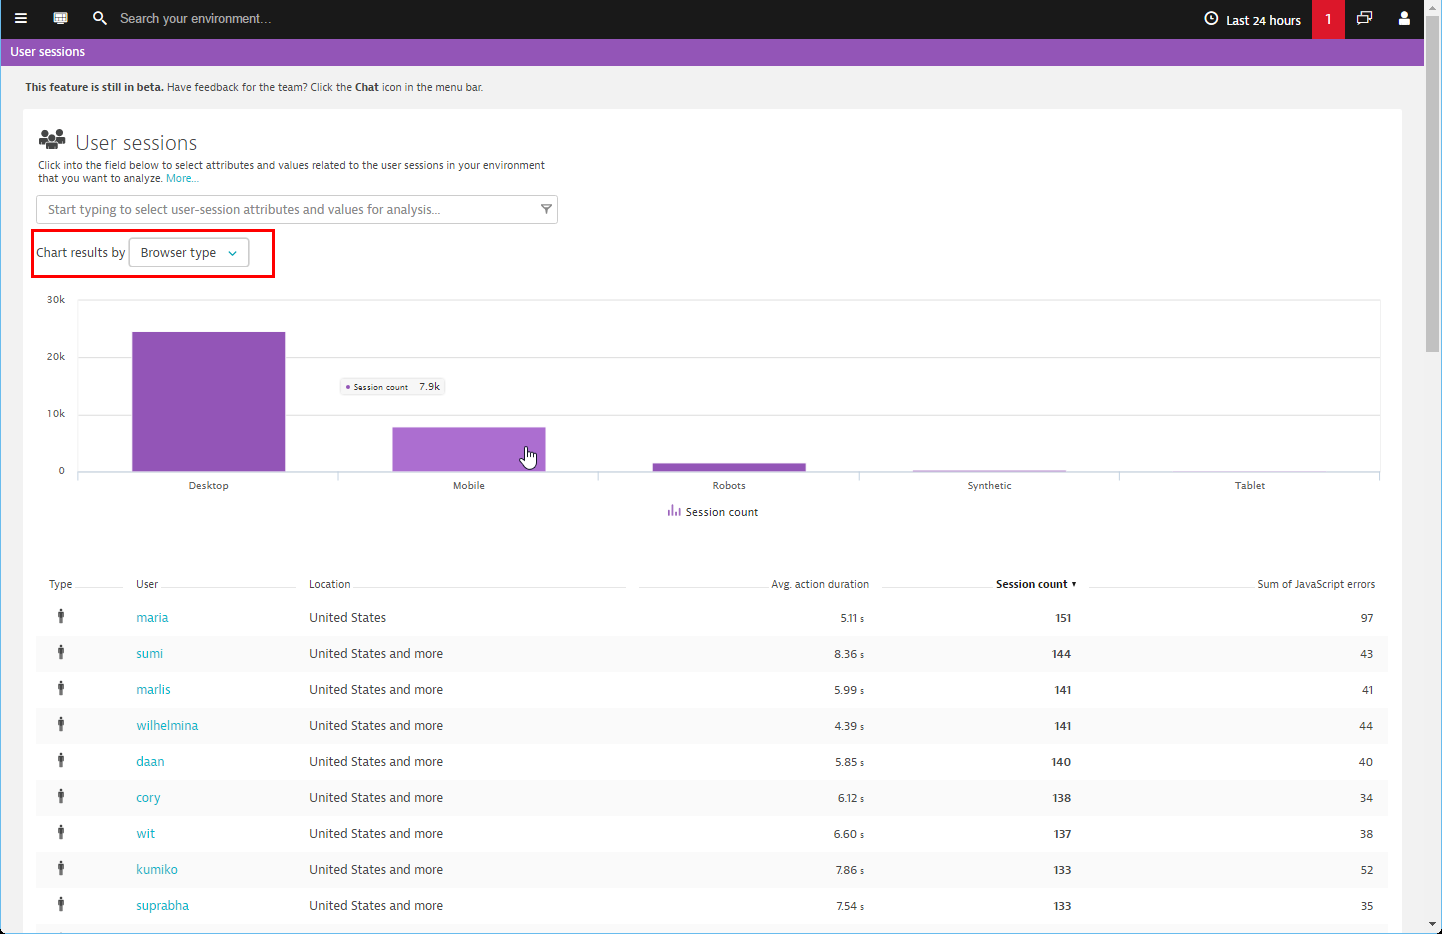
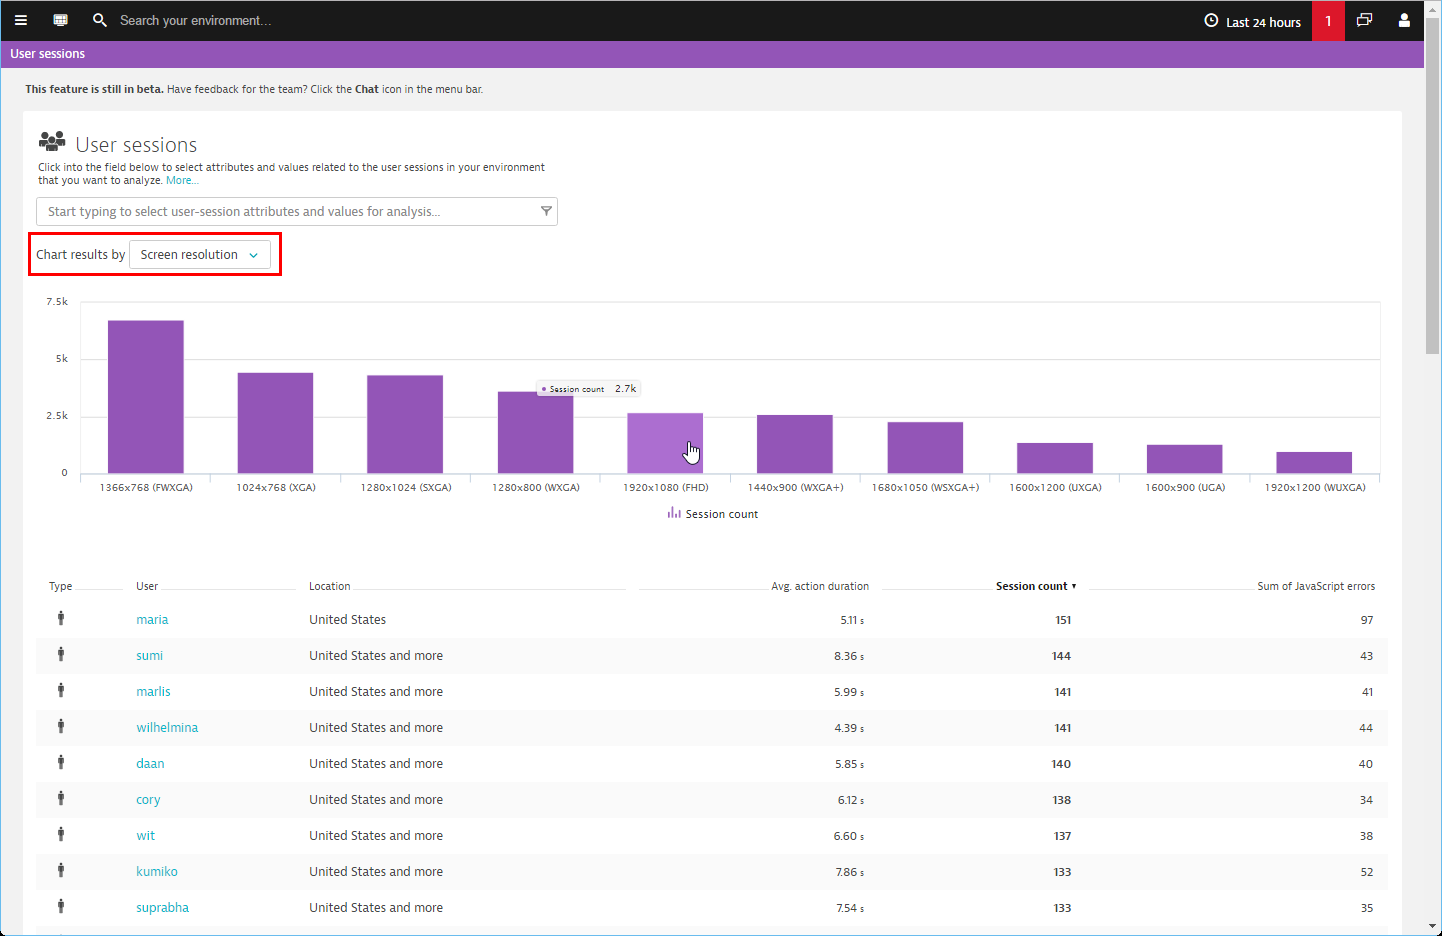
Chart filters
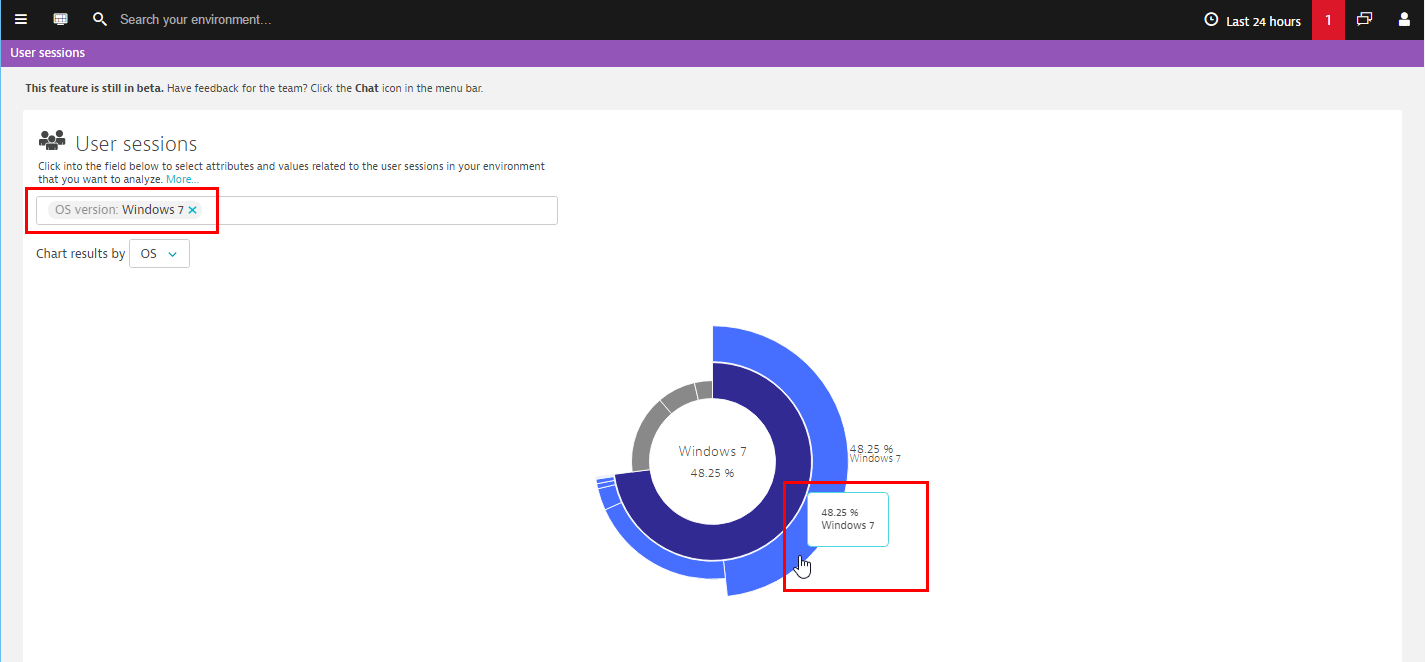
When you select sorting criteria from the Chart results by drop list, your filter criteria is automatically applied to both the chart and the list of top users at the bottom of the page (see example below).
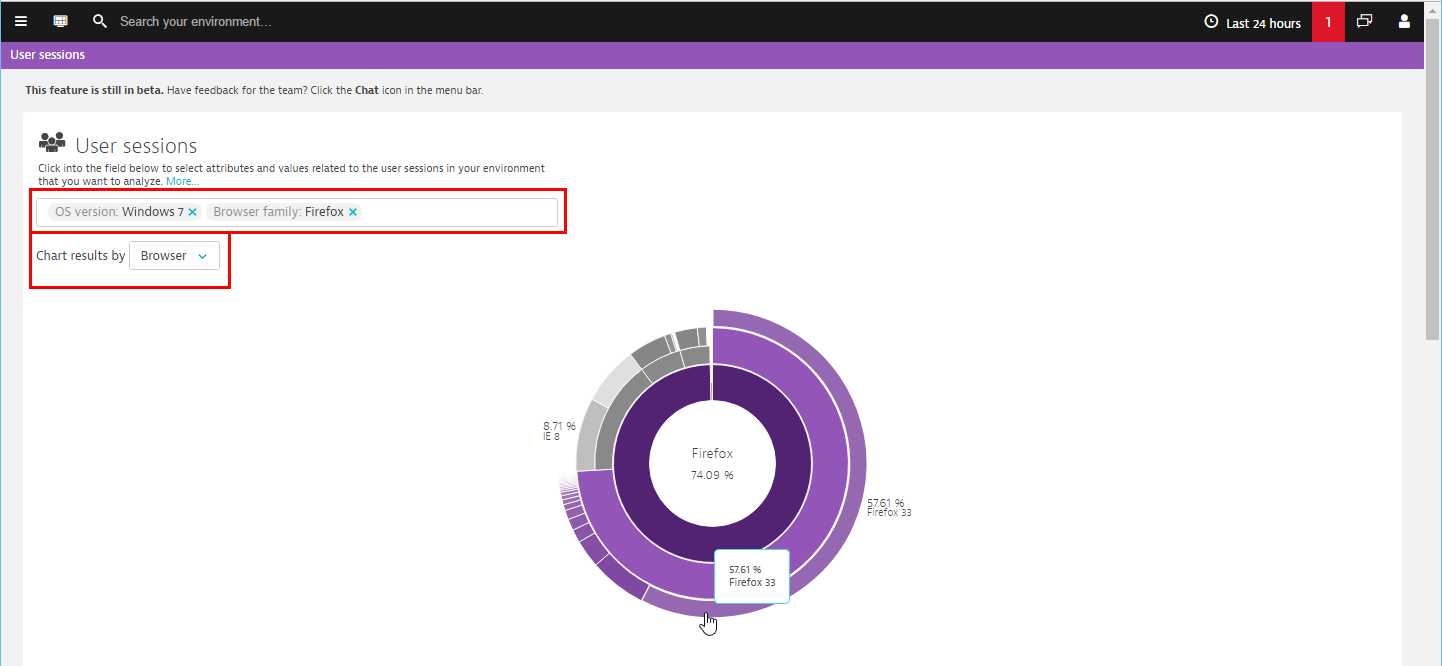
You can even combine filters to focus on specific user profiles. Note in the example below that the returned results include only those users who have the Windows 7 operating system and a Firefox v33 browser.
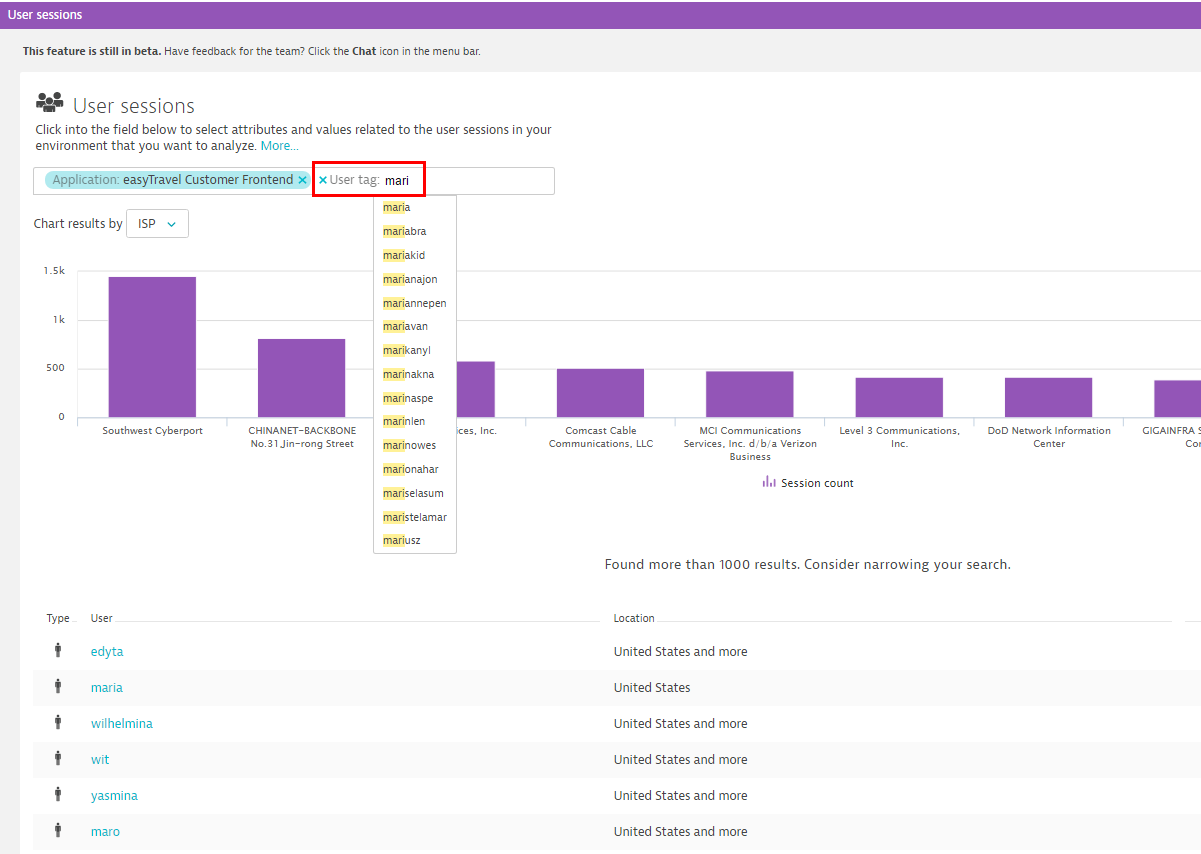
Search for specific users
You can use user-session filter criteria to search for specific users. 20 user session attributes are available to help you narrow your focus, including IP addresses and any user ID tags defined by your organization.
User tags
Typically user tags are comprised of email addresses or usernames, though they can also be team names or department names if your organization doesn’t want to or is prevented from tracking individual users.
User tags can be used by Dynatrace to track specific user behavior throughout your application environment, even across sessions, devices, and browsers. User tagging can be orchestrated via the Dynatrace JavaScript API for real user monitoring. Samples and documentation can be downloaded from within Dynatrace at Settings > Web monitoring > Custom user actions. Click the Download documentation and samples button. A sample HTML file called identifyUser.html can be found in the Sessions directory. The file has a correctly formatted JavaScript snippet .
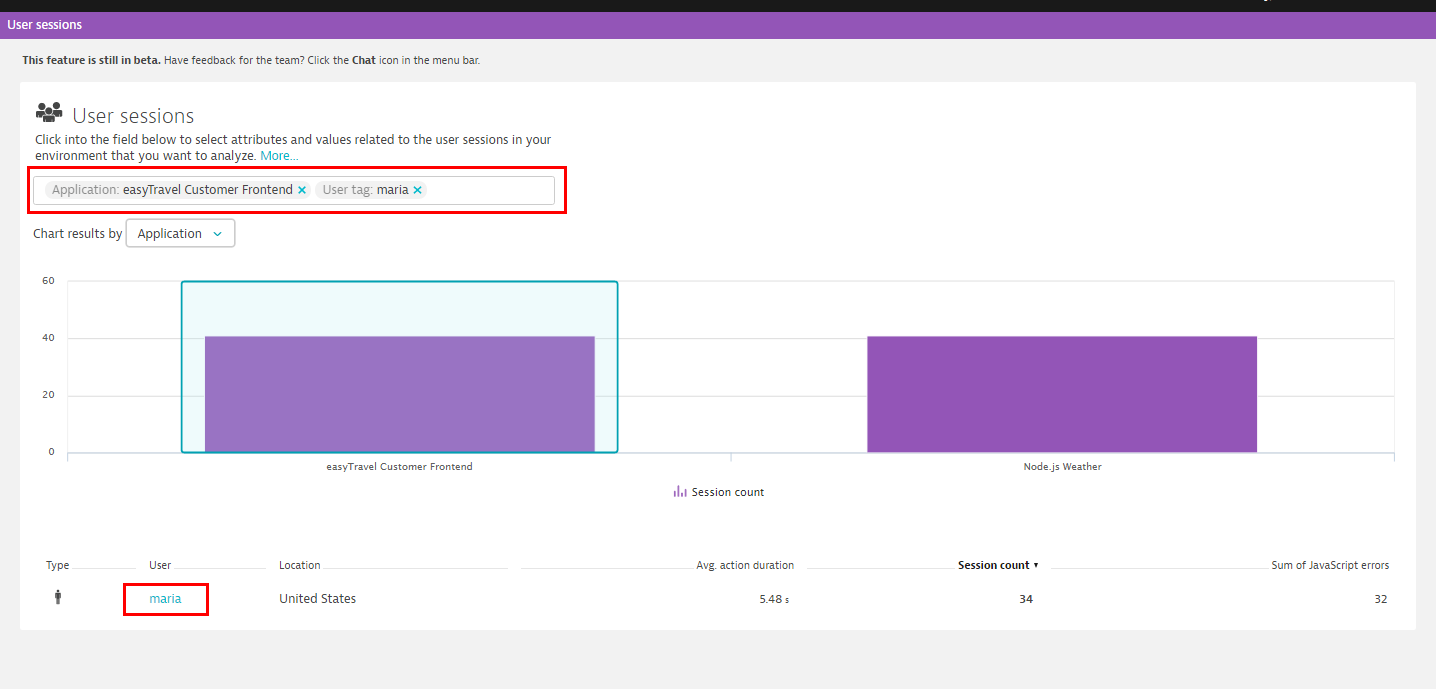
Click any user profile returned by your search to view the details of that user and a list of that user’s sessions.
Each user session can be selected so that you can drill down and view the entire click path of the session (see example below).
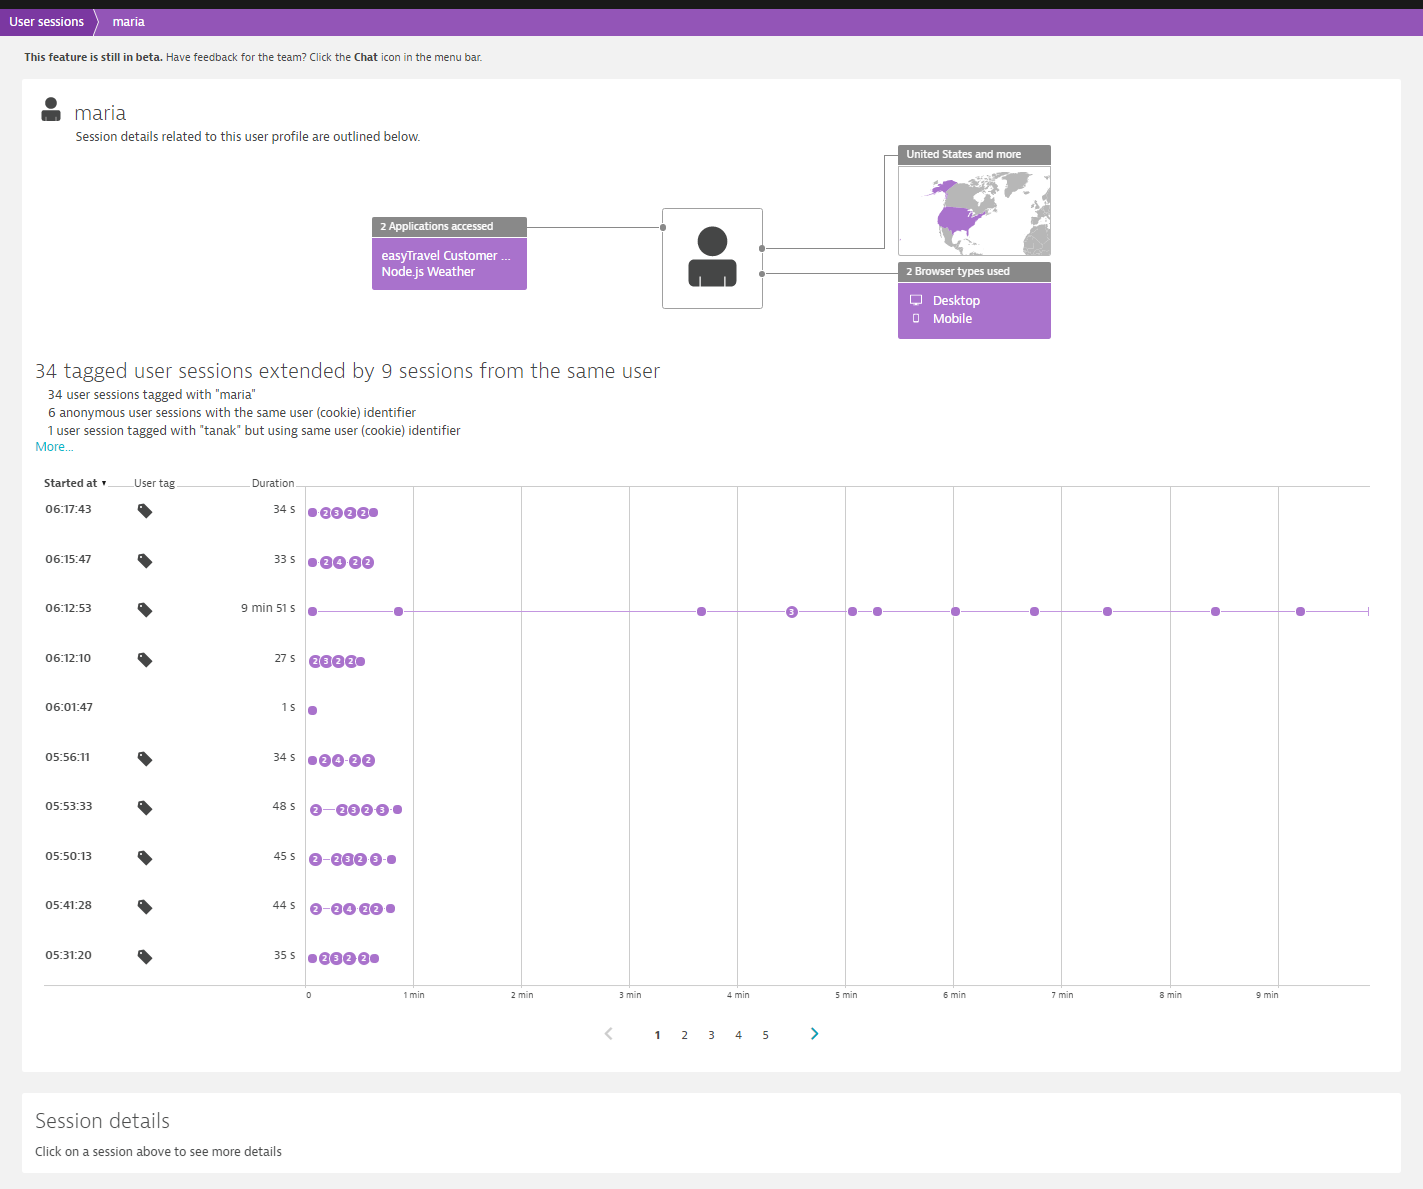
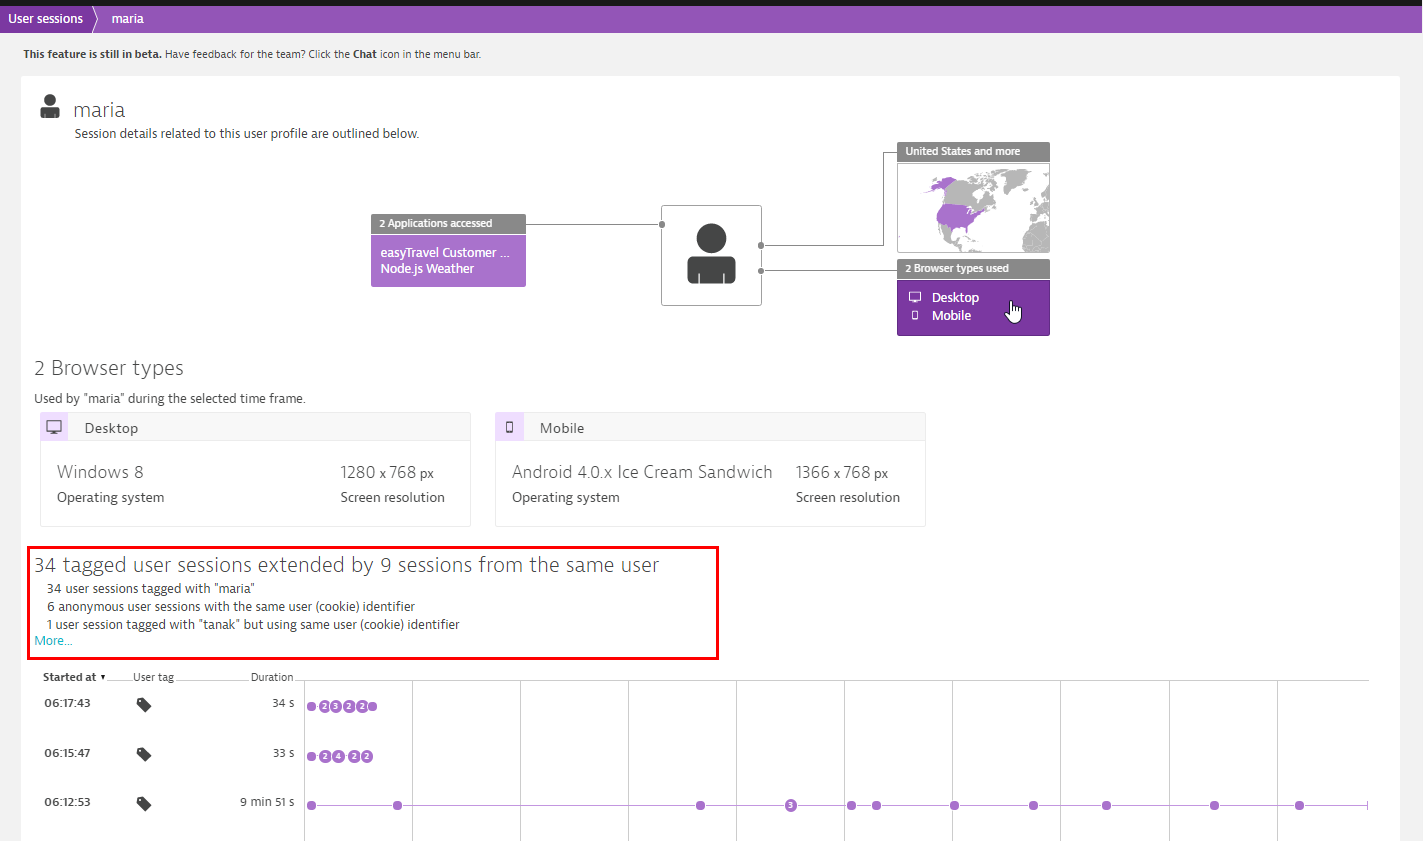
User sessions analysis
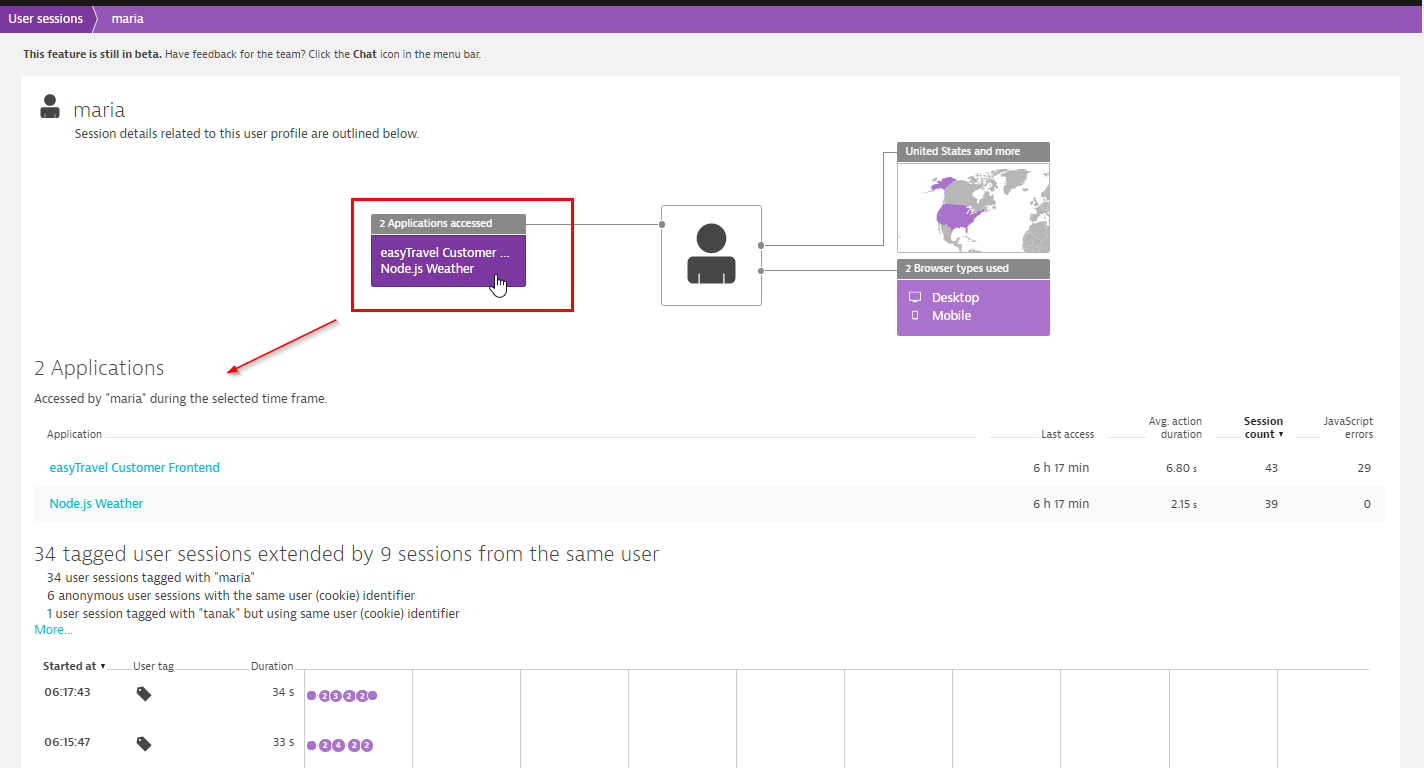
By clicking through the three sections of the User sessions infographic (see example below), you can see which of your applications the selected user has accessed, where the visits originated from, and which devices were used.
Beneath the infographic, you’ll find a summary of all of the selected user’s sessions. Dynatrace can typically show all of a selected user’s sessions, even when those sessions are anonymous or the user tag was changed or missing. This is achieved by storing a persistent cookie on the user’s browser that enables Dynatrace to assign anonymous user sessions to identified user sessions. This is helpful in situations where a user can’t log in due to an issue with the authentication service. As long as the user has logged into your application at least once, you will be able to search for and identify that user, even if they access your application via anonymous sessions.
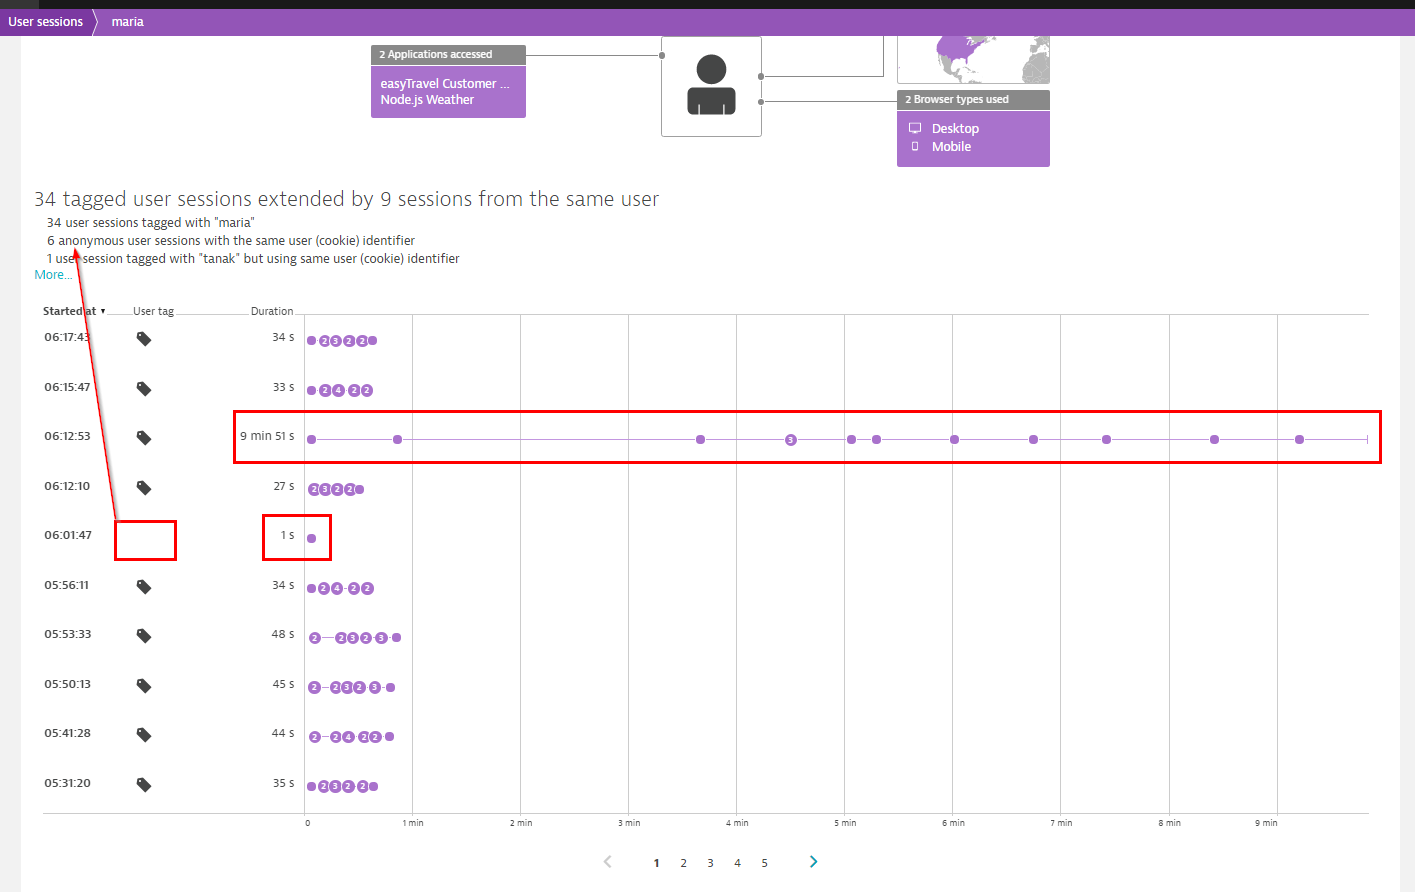
The user session list provides a graphical overview of all user sessions. To understand user behavior, it’s valuable to know the length of sessions and when those sessions take place.
Is there a lot of time “think or read” time between the user actions, or do the actions occur quickly? Every point detailed in the user session timeline is a user action, so at a glance you can easily see bounced sessions and user sessions that included numerous actions. When multiple actions take place nearly simultaneously, the clustered actions are consolidated into a single point in the timeline that shows the number of actions consolidated within the point. The next screenshot
Note in the example below that there is a session that lasts over 9 minutes and a session that included an anonymous bounce.
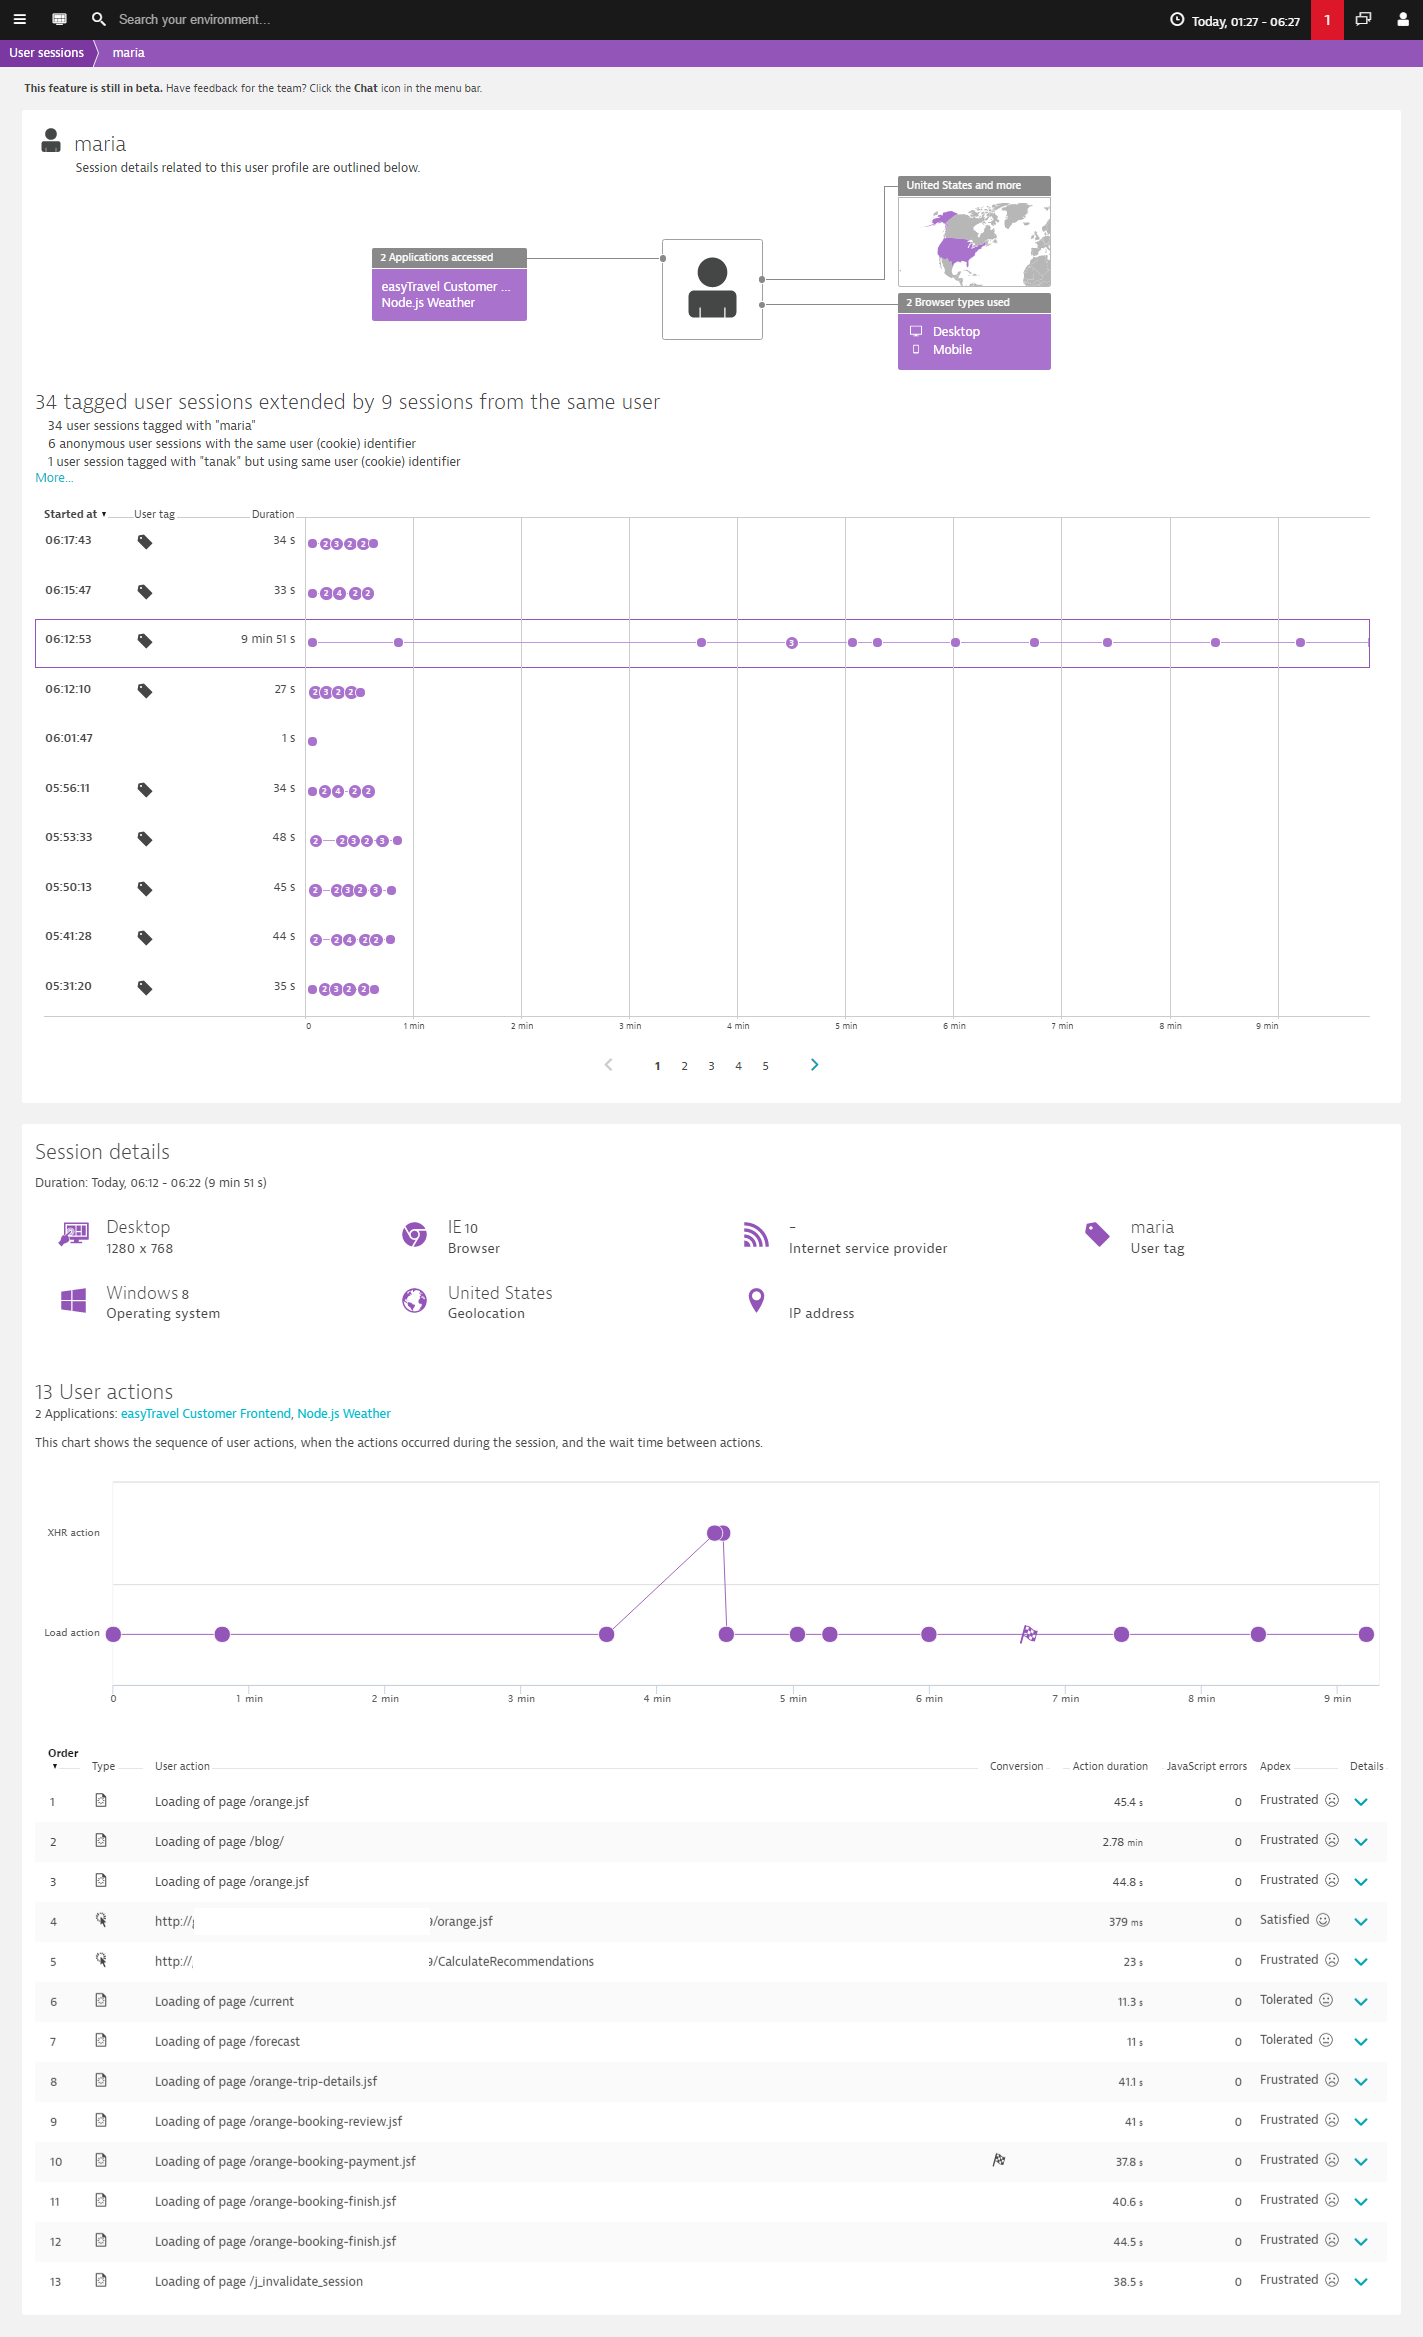
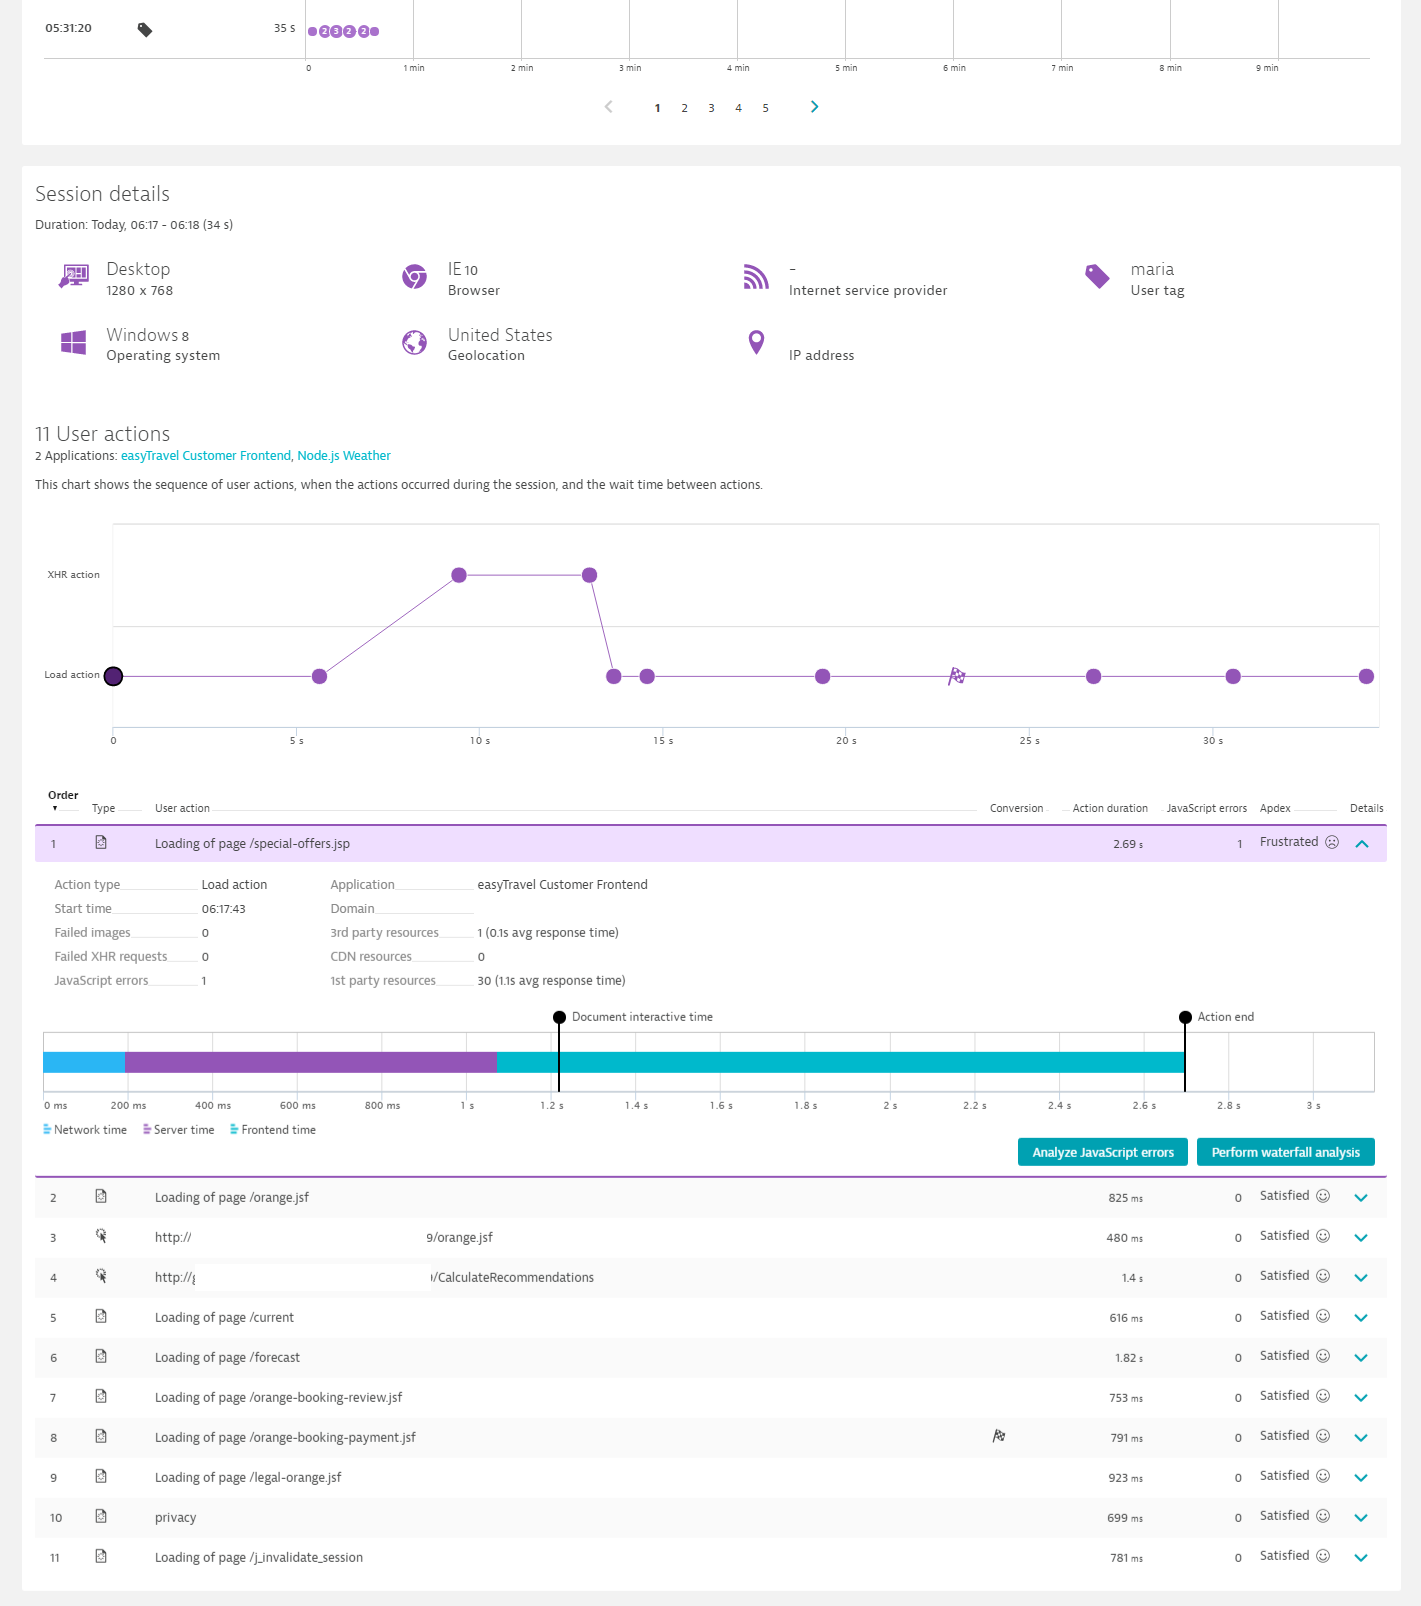
Select a user session from the list to view all details of the user session within a magnified timeline view (see example below). This timeline view shows when each user action occurred and provides a summary of the user session, including all session attributes. All user actions associated with the selected user session are listed beneath the timeline.
Over the coming weeks we’ll add more use cases and detail to Dynatrace user-sessions analysis, so be sure to check back.


Looking for answers?
Start a new discussion or ask for help in our Q&A forum.
Go to forum