
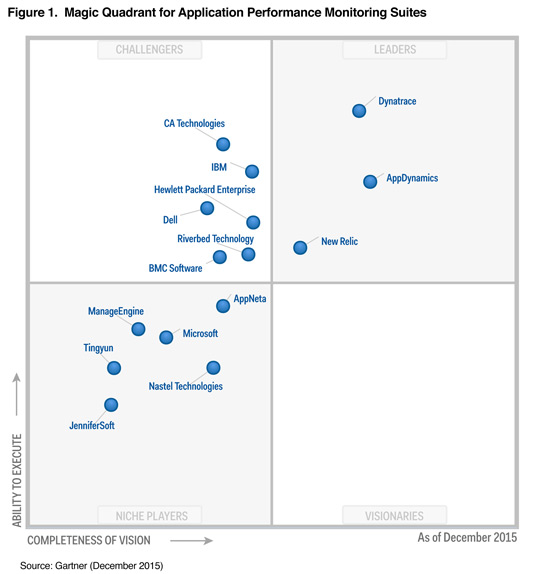
For a sixth consecutive year, Dynatrace* is positioned as a Leader in Gartner’s “Magic Quadrant for Application Performance Monitoring (APM) report”. This caps a record-breaking year for Dynatrace. In May, Gartner named Dynatrace the worldwide APM market share leader, with 12.5% of Revenue Share in the global market in 2014†. This is more than three times the revenue of other new generation APM vendors. The company is the industry’s leading performance management solution provider by technology breadth and depth, revenue and customer base and the only solution providing the full breadth required for Digital Performance Management.
I believe this Magic Quadrant both confirms our vision, and reinforces our Manifesto for business success. Successful businesses place value on:
- Customer experience above all else
- Investment in continuous innovation
- Simplicity to the max
- Fact-based decision making and
- Collaboration & accountability as company culture.
I couldn’t be more excited as we continue to evolve and further accelerate our leadership in this space built on these values.
Why Digital Performance Management does more than just target new buying centers
In the report, our new market position, leading with a Digital Performance Management message over APM was mentioned. This isn’t just a marketing message. We believe Digital Performance Management is an evolution of APM; physically and virtually different from APM. Here’s why:
Gartner defines APM as having five dimensions of functionality:
- End-user experience monitoring (EUM)
- Application topology discovery and visualization
- User-defined transaction profiling
- Application component deep dive
- IT operations analytics
Performance analytics has already grown beyond IT. Gartner mentions business analytics as result of doing IT operations analytics but in reality the dataset is composed of quantitative infrastructure stats. We can all agree this is CRITICAL, but…
What’s missing?
What about user experiences that don’t hit our instrumented digital properties (i.e. call centers, social, in-store) and user perception data/voice of customer (i.e. surveys, heat maps, eye tracking, focus group research)? Mature business leaders are already doing the after-work to combine these qualitative and quantitative data sets to make more educated decisions. The writing is already on the wall, if you look closely…it says Digital Performance Management.
As a leader in APM 6 years running we feel it’s our responsibility to charter the market. This time next year I hope to see us in the DPM Magic Quadrant!
Stay tuned here and on www.dynatrace.com/blog as we continue to define and explain these observations.
*formerly Compuware in 2010 – 2014
Gartner does not endorse any vendor, product or service depicted in its research publications, and does not advise technology users to select only those vendors with the highest ratings or other designation. Gartner research publications consist of the opinions of Gartner’s research organization and should not be construed as statements of fact. Gartner disclaims all warranties, expressed or implied, with respect to this research, including any warranties of merchantability or fitness for a particular purpose.
†Market Share Analysis: Application Performance Monitoring, 2014
27 May 2015 by Federico De Silva


Looking for answers?
Start a new discussion or ask for help in our Q&A forum.
Go to forum