
Dynatrace captures user experience and performance data by monitoring individual user actions. Typically a user action begins with a click on an HTML control (for example, a button or link). The browser then loads the requested data, either by navigating to a new page or via an XHR/fetch call. JavaScript callbacks are then executed, the DOM tree is built or changed, and the web application is then once again ready for a new user action. Dynatrace Waterfall analysis view is the perfect tool for analyzing all such user-action monitoring data in detail.
A previous blog post, Waterfall analysis findings & individual user action instances, explains how top findings for each monitored user action make it easy to identify common problems in your web application. The blog post also explains the differences between analyzing a single instance waterfall and analyzing an aggregated waterfall. In this blog post, I’ll recap some basics and then dive into the recent changes that we’ve introduced to make waterfall analysis an even more compelling tool for your daily performance analysis efforts.
What data is displayed in Waterfall analysis view?
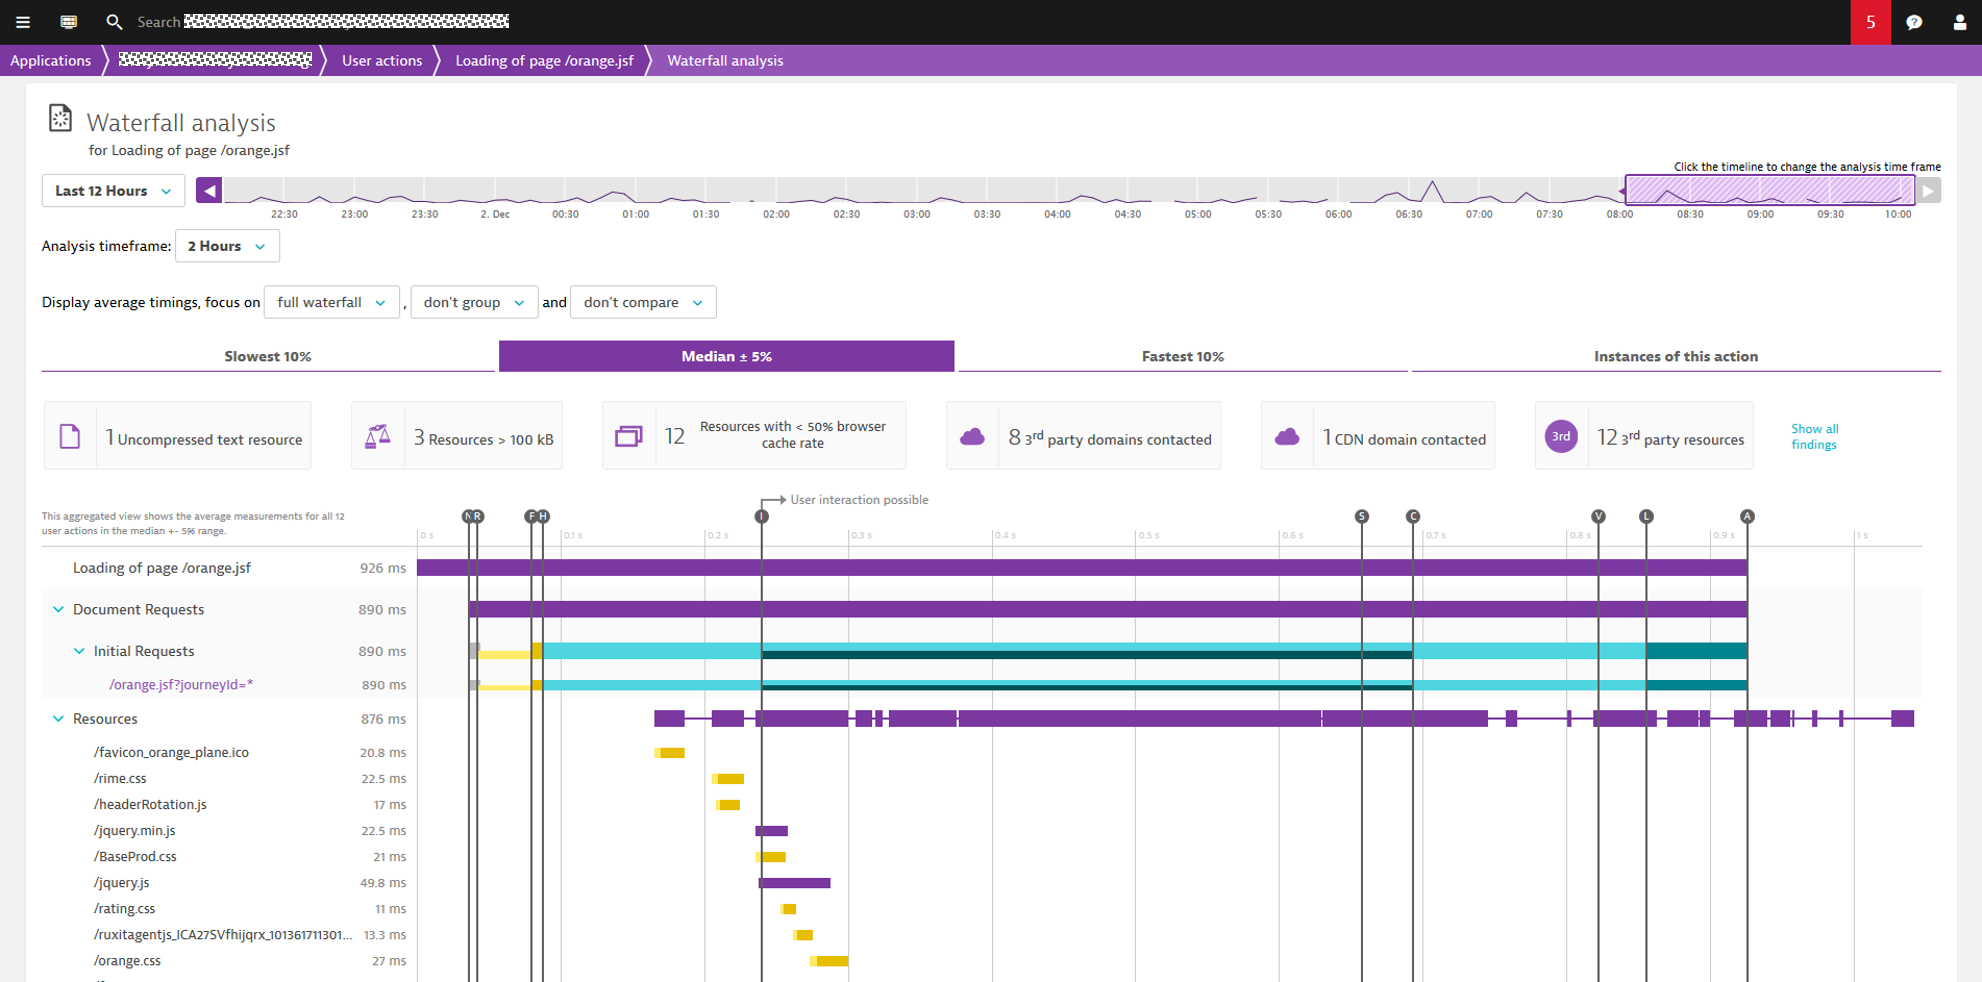
Waterfall analysis view is primarily built around W3C timings. We’ve added additional details and timings that you may find useful. The view organizes the waterfall entries into three sections:
- Document requests – Displays all content that is identified as the page load of the user action. This includes the initial HTML, as well as any other content that’s displayed in frames. Each entry contains the details that are captured by W3C navigation timings.
- XHR requests – Displays all resources that were sent via XHR or
fetch(). These entries contain all the details that are accessible through the W3C resource timings, in addition to the JavaScript callback execution time. - Resources – Displays all W3C timing details for all resources.
A user action may contain more than a single page load or XHR. Therefore, the initial request is highlighted in purple. The timings of the initial request are displayed as vertical event lines above the chart. In addition to the W3C timings, Speed index, Visually complete, and User action duration are also displayed as event lines.
Recent enhancements to Waterfall analysis view
Now let’s take a look at the enhancements we’ve made to Waterfall analysis view.
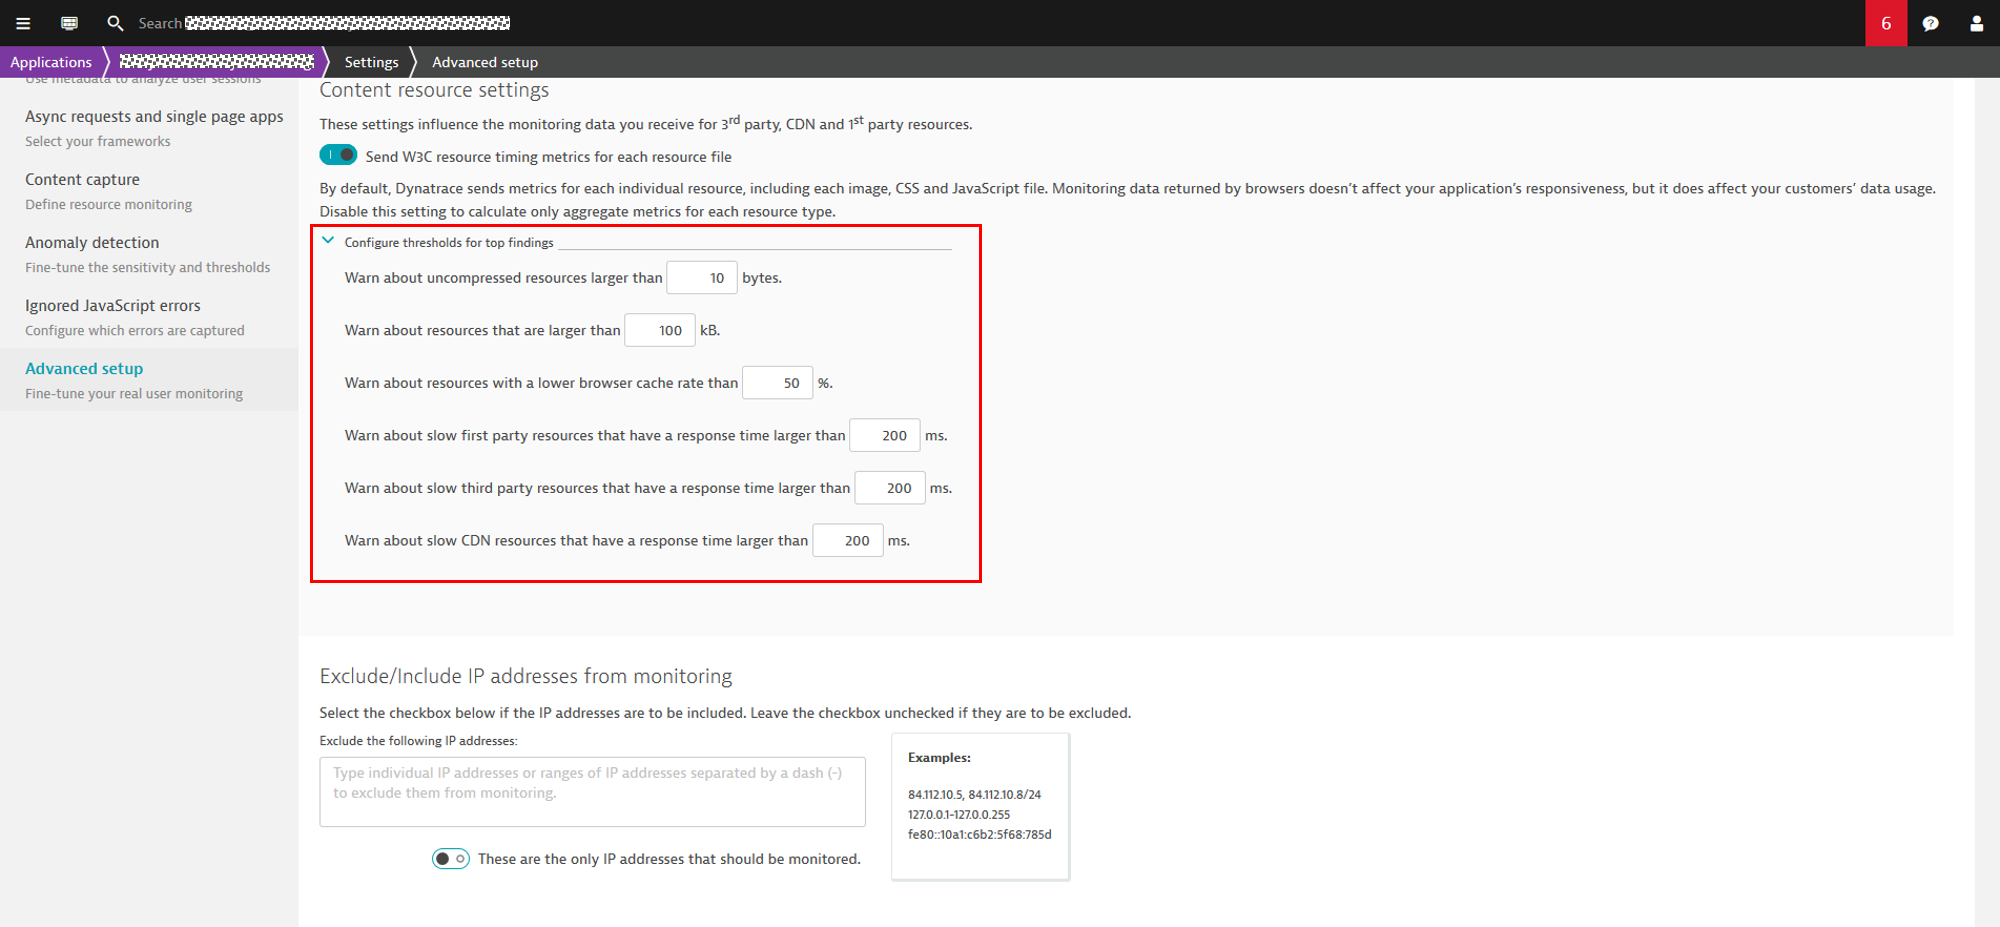
Configure top finding thresholds
To configure thresholds for top findings
- Select Applications from the navigation menu.
- Select the application you want to configure.
- Click the […] browse button and select Edit.
- Select the Advanced setup tab.
- Within the Content resource settings section, expand the Configure thresholds for top findings section.
Resource type configuration
In Waterfall analysis view, you can group resources based on type. Since the MIME type isn’t accessible from JavaScript, the resource type is determined based on the file extension. If certain resources don’t have a proper extension, you can configure URL matching rules to define those resource types.
To define a URL matching rule to define a resource type
- Select Settings from the navigation menu.
- Expand the Web and mobile monitoring settings tab.
- Select Resource types.

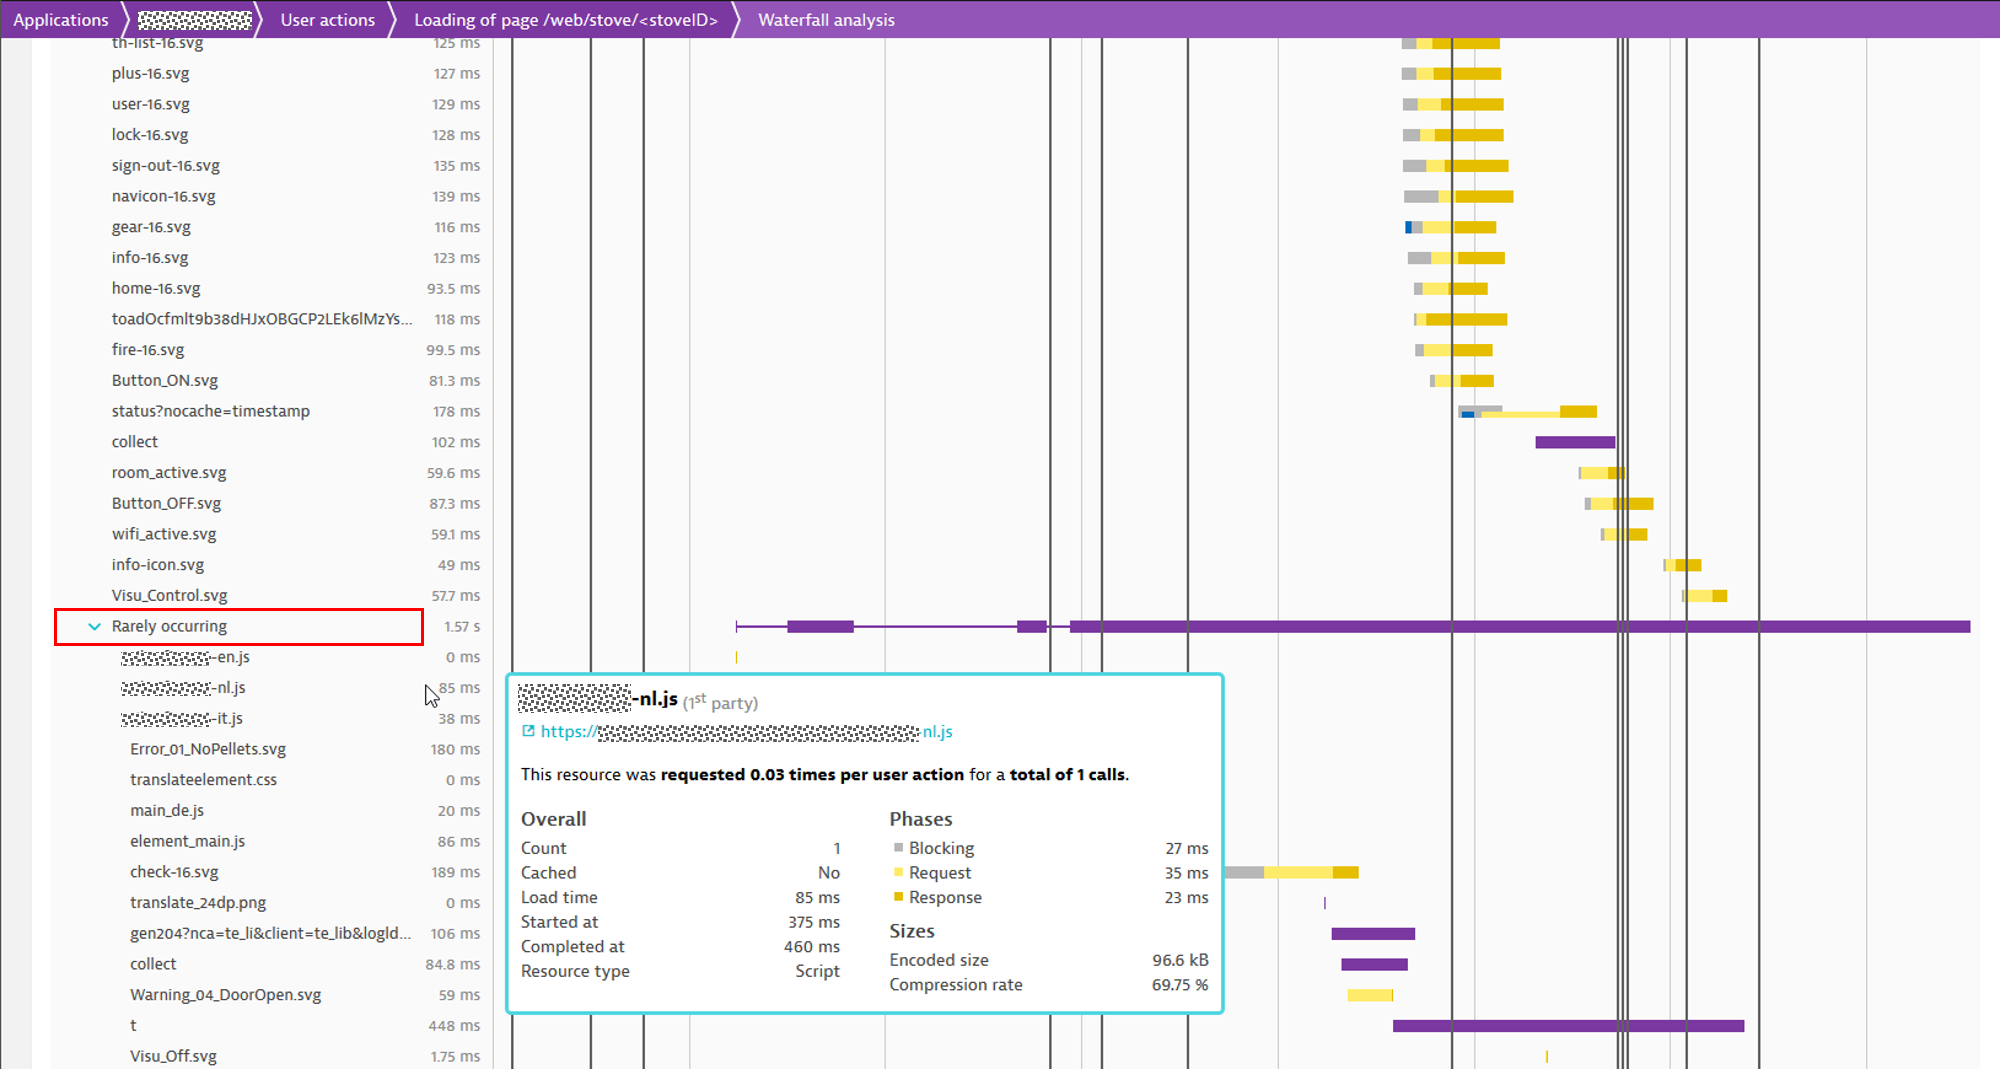
Rarely occurring resources
To keep the aggregated Waterfall analysis view down to a reasonable and readable size, resources that occur in less than 30% of user action instances are moved to a Rarely occurring resource group. You can expand this group to view the rarely occurring resources. Note all the detail that’s returned in the roll-over highlight pane.
URL cleanup rules
In aggregated Waterfall analysis view, resources are aggregated based on their URLs. Often, IDs and other random numbers prevent resources from being correctly aggregated. When this happens, some important resources may unintentionally appear in the Rarely occurring resources list.
To define a URL cleanup rule
- Select Settings from the navigation menu.
- Expand the Web and mobile monitoring settings tab.
- Select Resource URL cleanup rules.
- Define regular expressions to remove the IDs.

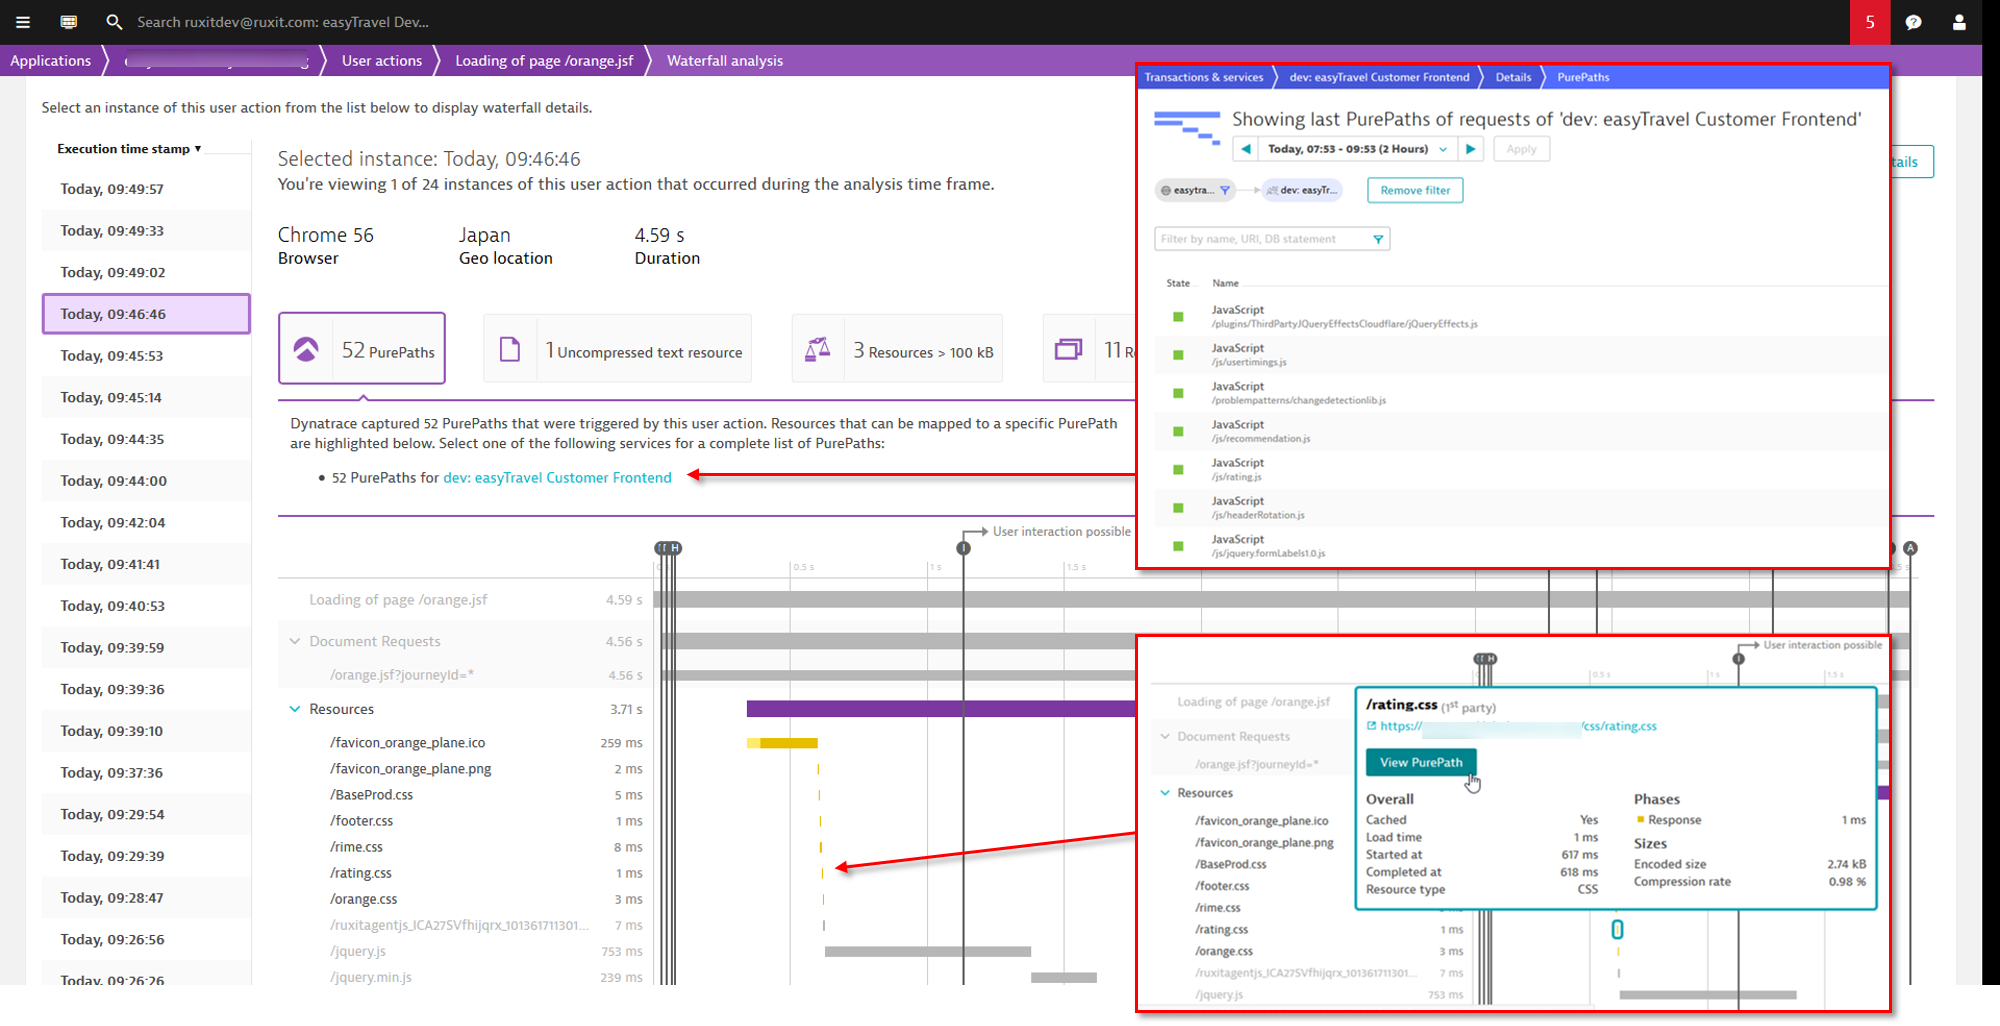
End to end visibility and drill down to PurePaths
A new top finding called PurePaths is available when you use Waterfall analysis view to analyze the performance of a single user action instance for which PurePaths are available. The example below shows that 52 PurePaths related to the selected user action instance are available for analysis. Select the PurePaths tile to get a link to the list of associated PurePaths. The top findings also highlight all resource entries in the waterfall analysis chart for which PurePaths are available.
Please note the following limitations:
- End-to-end visibility requires a OneAgent instance running on the server side. You’ll only see the top findings when PurePaths are actually available.
- For processes that are under heavy load, Dynatrace OneAgent automatically adjusts how much data is sent to Dynatrace Server. Therefore, certain PurePaths may not be available.
- Drill down from a waterfall resource (based on W3C resource timings) to a PurePath (captured by OneAgent) is done by comparing the URLs. If there are any rewrite rules, or if parts of the URL aren’t identical on the client and server sides, the View PurePath button won’t be displayed. In such cases, you can get to all your PurePaths by clicking the PurePath tile included in the top findings.
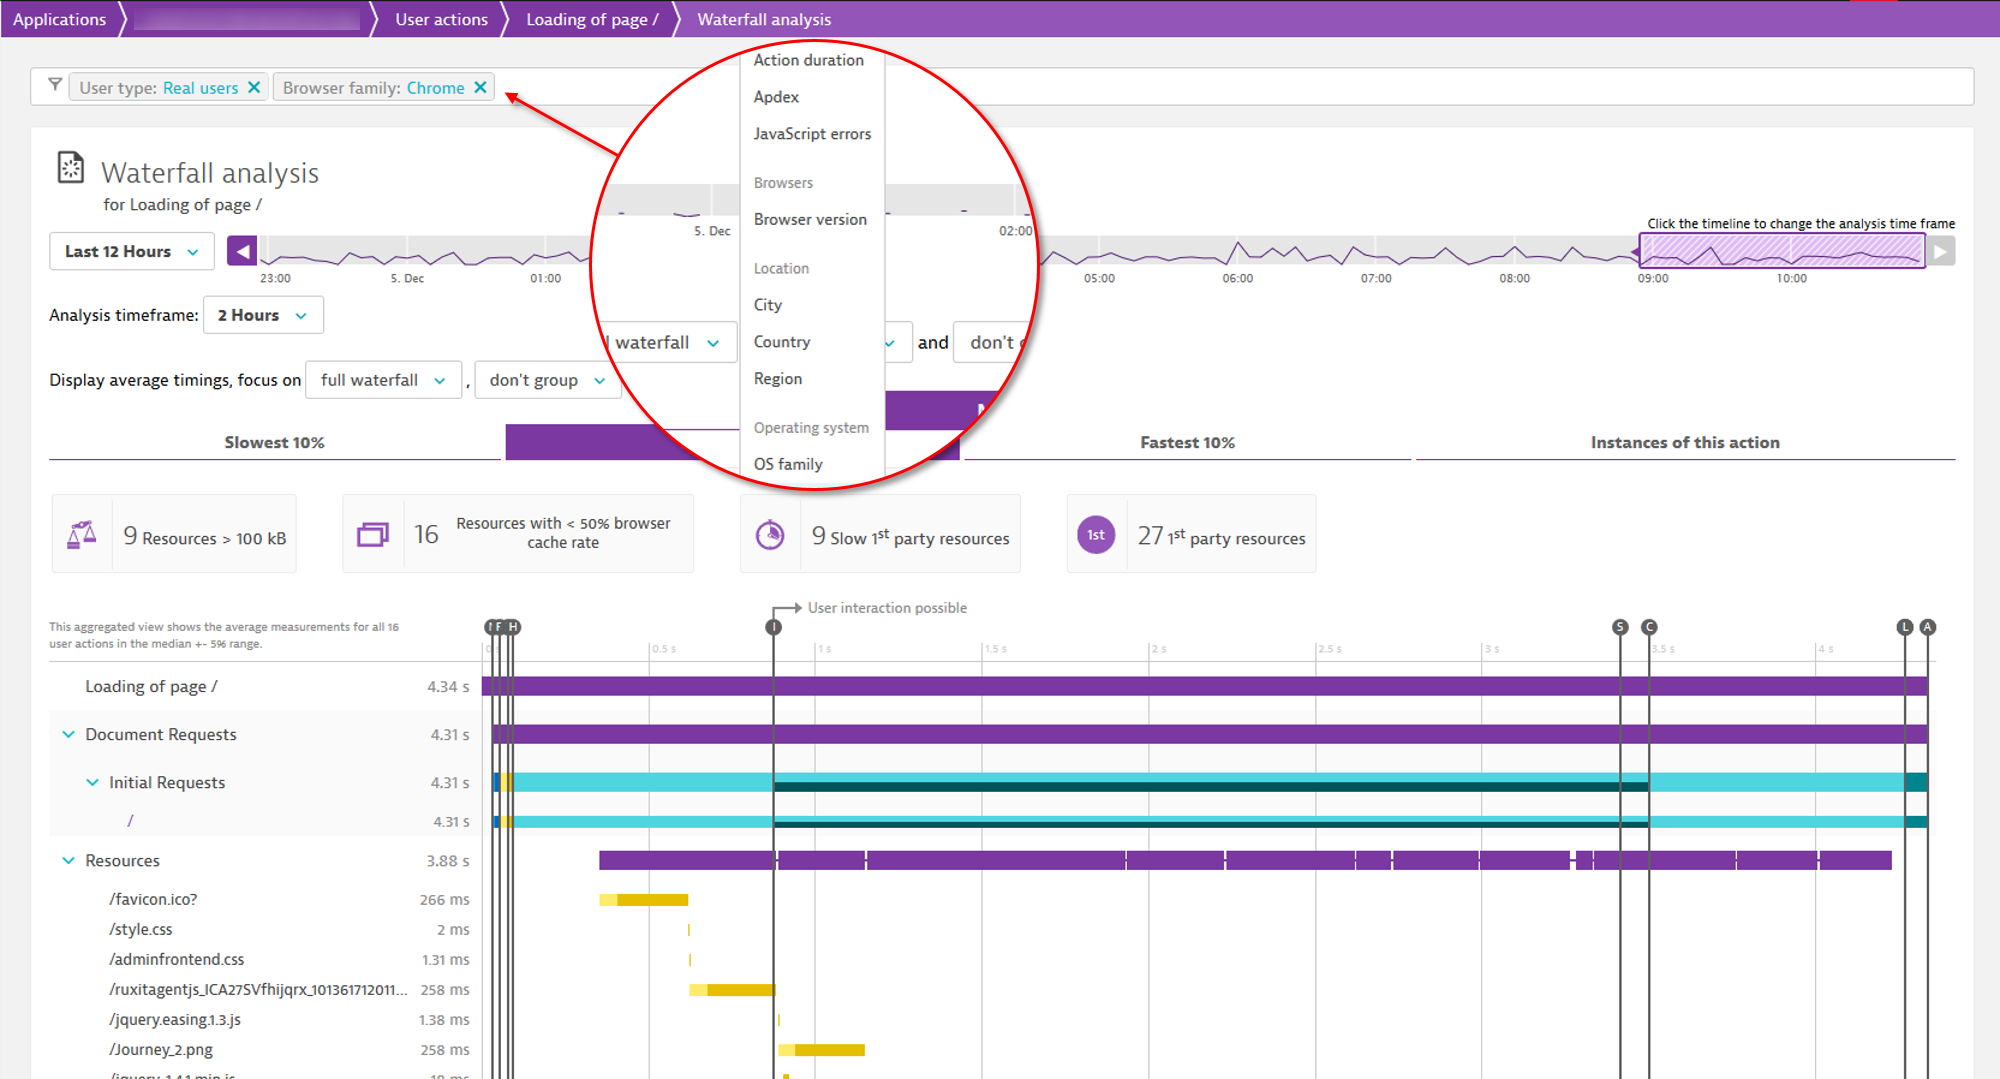
Filter bar
It’s now possible to filter user actions based on a variety of attributes, including user type, browser family, location, and more. This allows you to get even more detailed insights into the performance of specific user segments.


Looking for answers?
Start a new discussion or ask for help in our Q&A forum.
Go to forum