
There’s nothing more disastrous for a mobile-app publisher than a new version release with a high crash rate. If your latest app release results in a high number of crashes, you’re guaranteed of providing your users with poor user experience—and a good reason for them to give your app a negative marketplace review. This is why the latest release of Dynatrace provides automatic detection of unusually high crash rates within specific versions of mobile iOS and Android apps.
Once you’ve instrumented your iOS or Android app with OneAgent, Dynatrace automatically tracks crash rates across version releases over time. The baseline crash rate for each app version is tracked and reported in real-time within crash reports that provide code-level detail, so you can easily track down the root causes of crashes. Crash reports are available on each Mobile application page.
To view crash reports for a specific mobile-app version
- Select Mobile applications from the navigation menu.
- Select the application you want to analyze.
- On the Mobile application page, click the Crashes portion of the infographic.
- From the All app versions drop-down list, select the app version you want to analyze. Or select All app versions to view crash reports across all versions.
Crash-rate detection
While changes in a mobile app’s baseline crash rate can be caused by a range of issues, crash rate increases are typically caused by either faulty new releases or unexpected issues within backend services. By tracking baseline crash rates across releases, Dynatrace is able to quickly alert you when a new release crashes at an unusually high rate. To detect increased crash rates within previously released versions, Dynatrace tracks each app version’s crash rate over time and alerts you when a version’s crash rate increases suddenly.
Once Dynatrace detects an unusually high crash rate within one of your app versions, a new Mobile app crash rate increase problem is created (see example below) and you’re alerted immediately. Each Problem details page includes all available information regarding the crash.
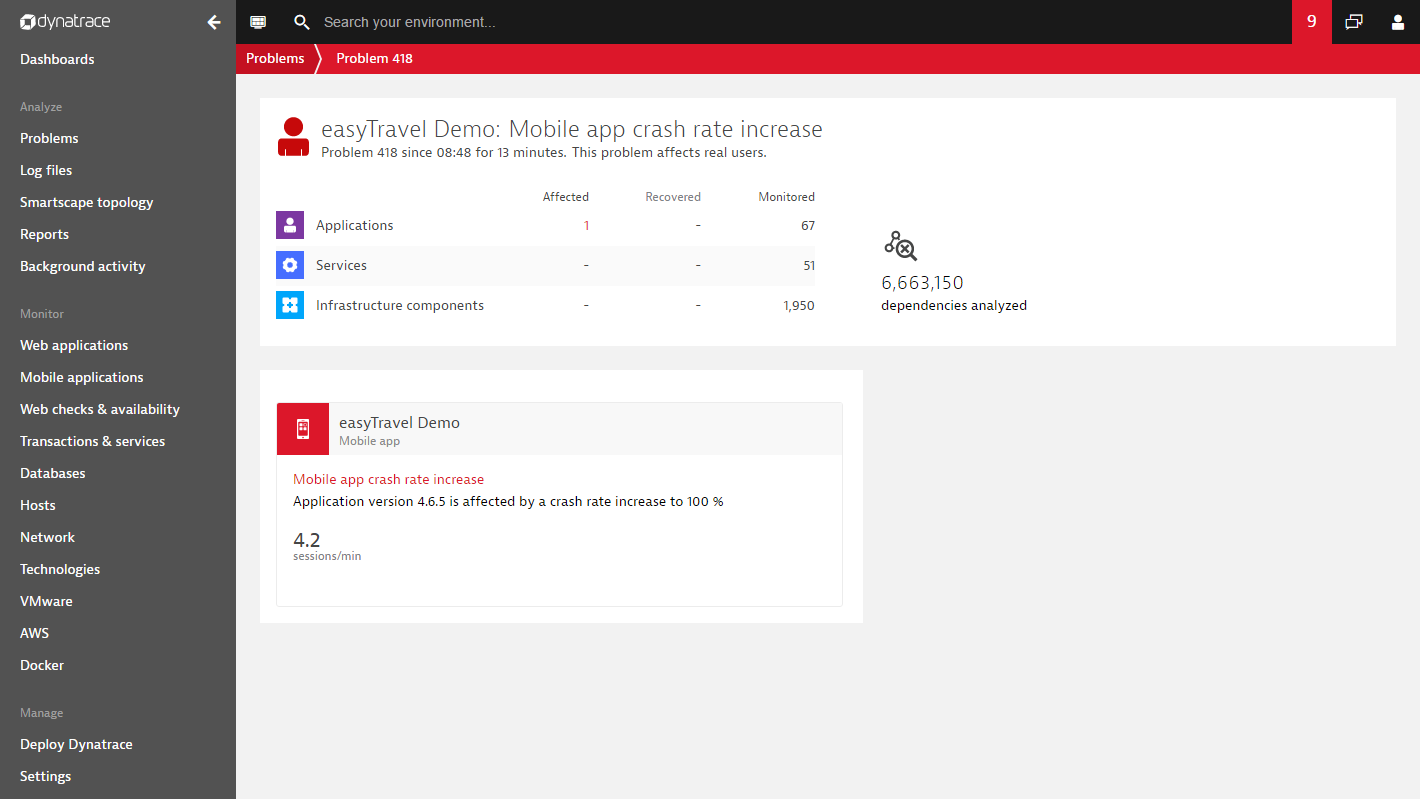
The example problem above shows that a 100% crash rate increase was detected within the easyTravel Demo mobile application. The problem also shows that the high crash rate is specific to version 4.6.5 and that it only affects 4.2 sessions per minute.
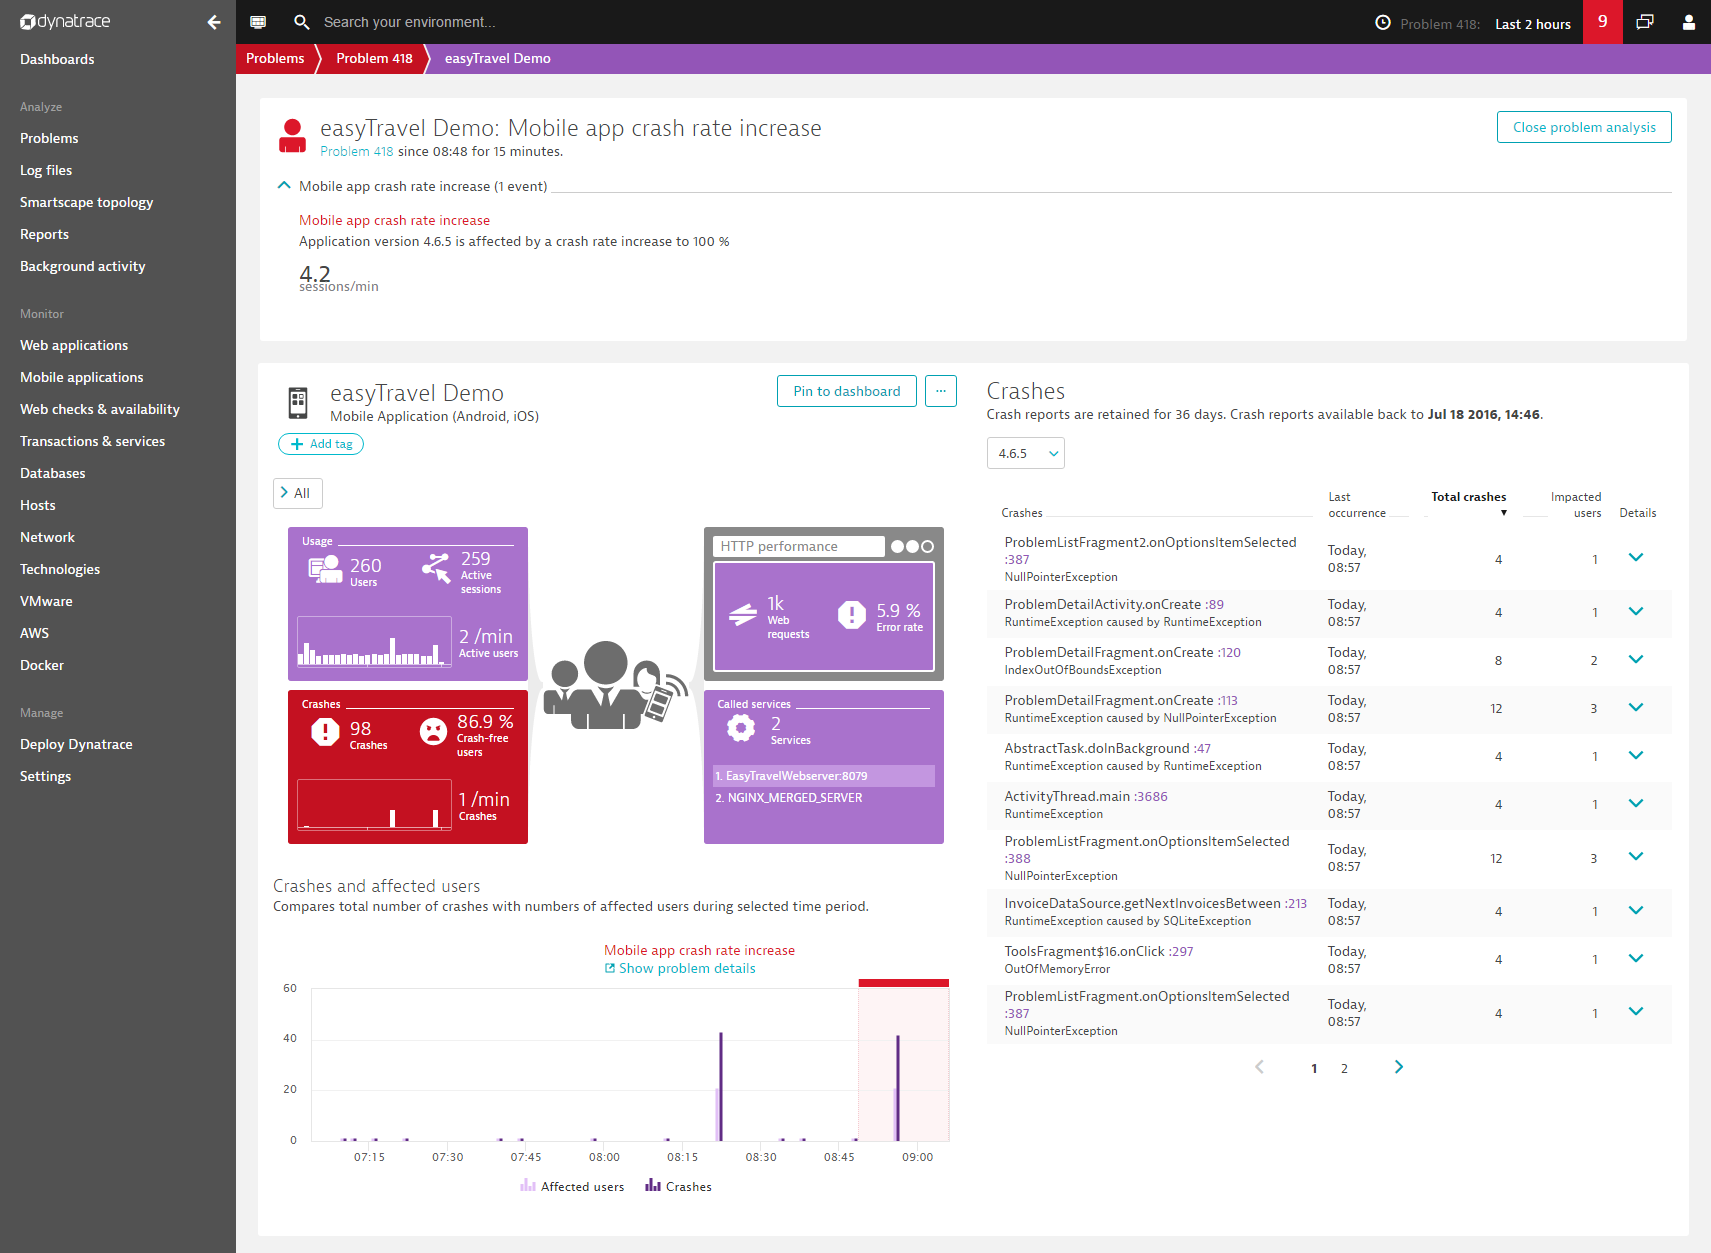
Clicking on the Problem above takes you to the Crashes page for this mobile app (see example below). This page includes a list of crash reports and code-level details about the detected problem. And because this page is shown in the context of the detected problem, the Crashes and affected users chart timeline is set to the time of the problem and the Crashes list includes only those crash reports that relate to the affected version.
Over the coming weeks, we will further enhance our mobile app anomaly detection capabilities to detect problems that occur during the application-release phase, as well as web request errors and slowdowns.


Looking for answers?
Start a new discussion or ask for help in our Q&A forum.
Go to forum