Monitor Docker containers
Dynatrace version 1.267+
Starting with Dynatrace version 1.267, the Docker overview page is no longer available.
See the Container groups page instead for data on:
Docker containers
Containers deployed in Kubernetes/OpenShift
Additionally, all the content below, except Limitations, is deprecated and no longer valid.
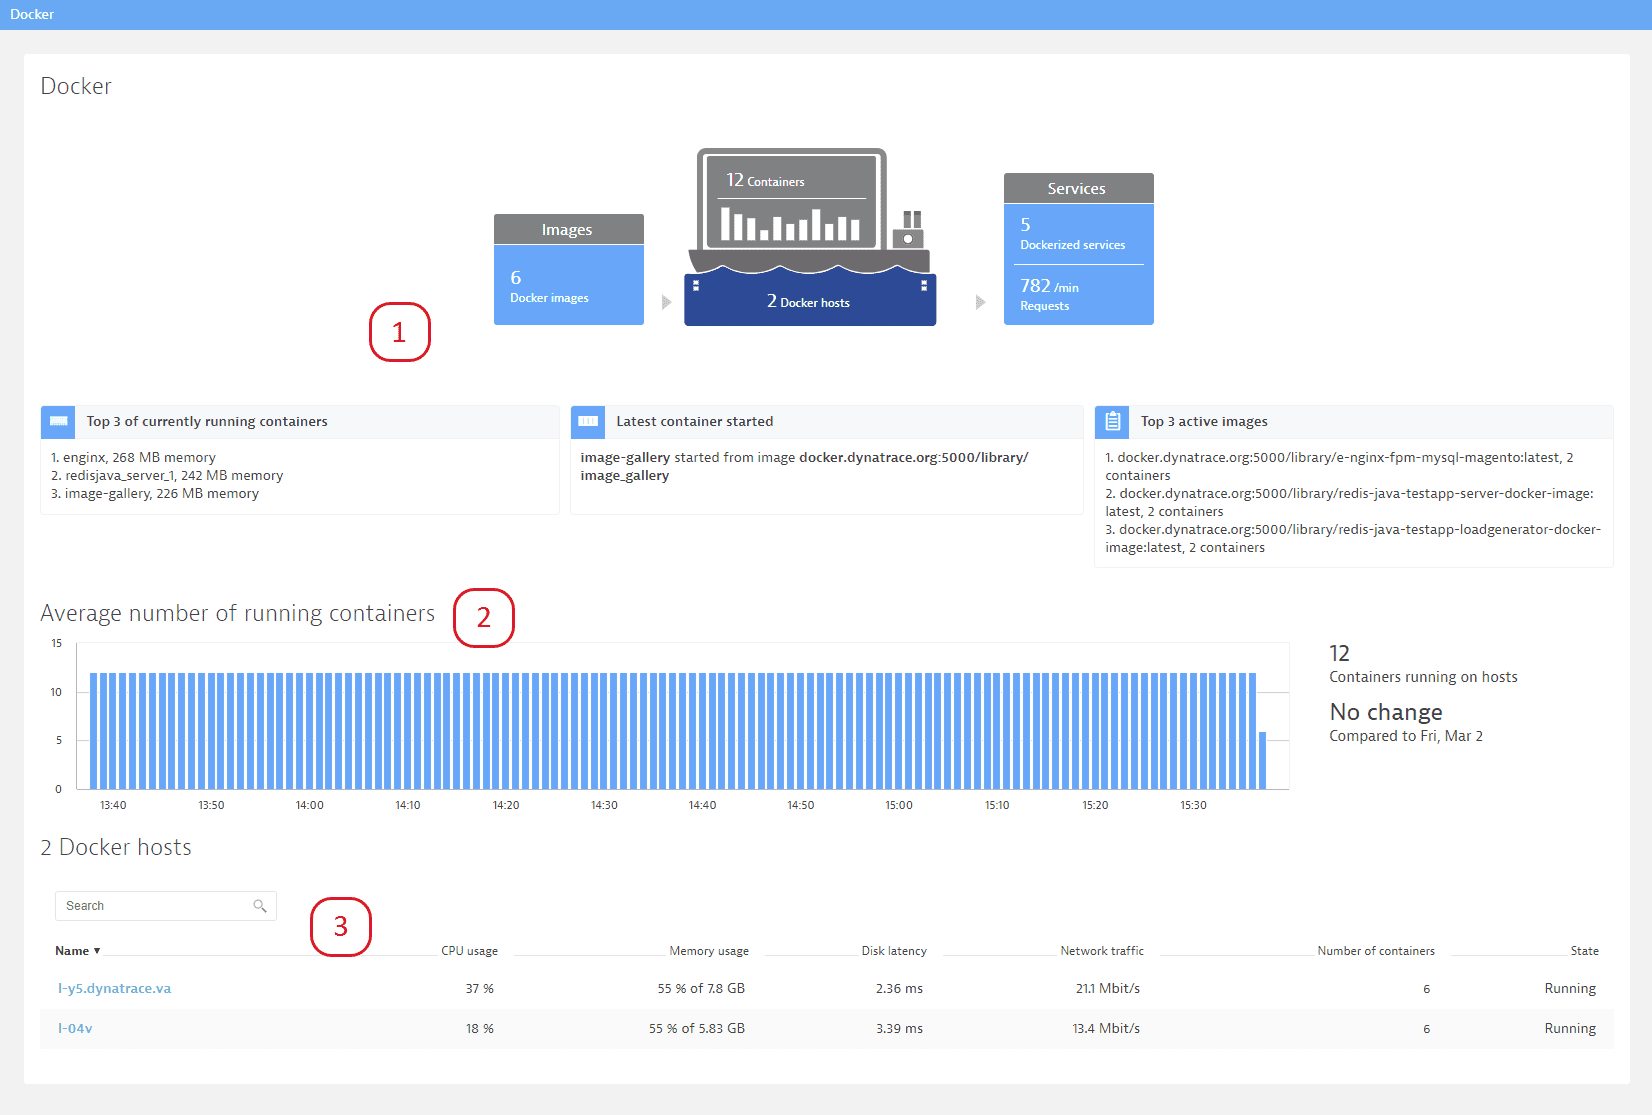
The Docker overview page (in Dynatrace, go to Docker) provides a summary of the most relevant information:
- The infographic at the top of the page displays the following:
Number of running containers
Top 3 containers consuming the most memory
Most recently started container
Most frequently used images
- The Average number of running containers section of the page provides deep insights into the dynamics of your Dockerized environment by showing you how the number of containers has evolved over the past 7 days.
- The Docker hosts section at the bottom of the page shows resource usage of individual Docker hosts. This information helps you make decisions about capacity planning and container provisioning.
Monitor Docker containers
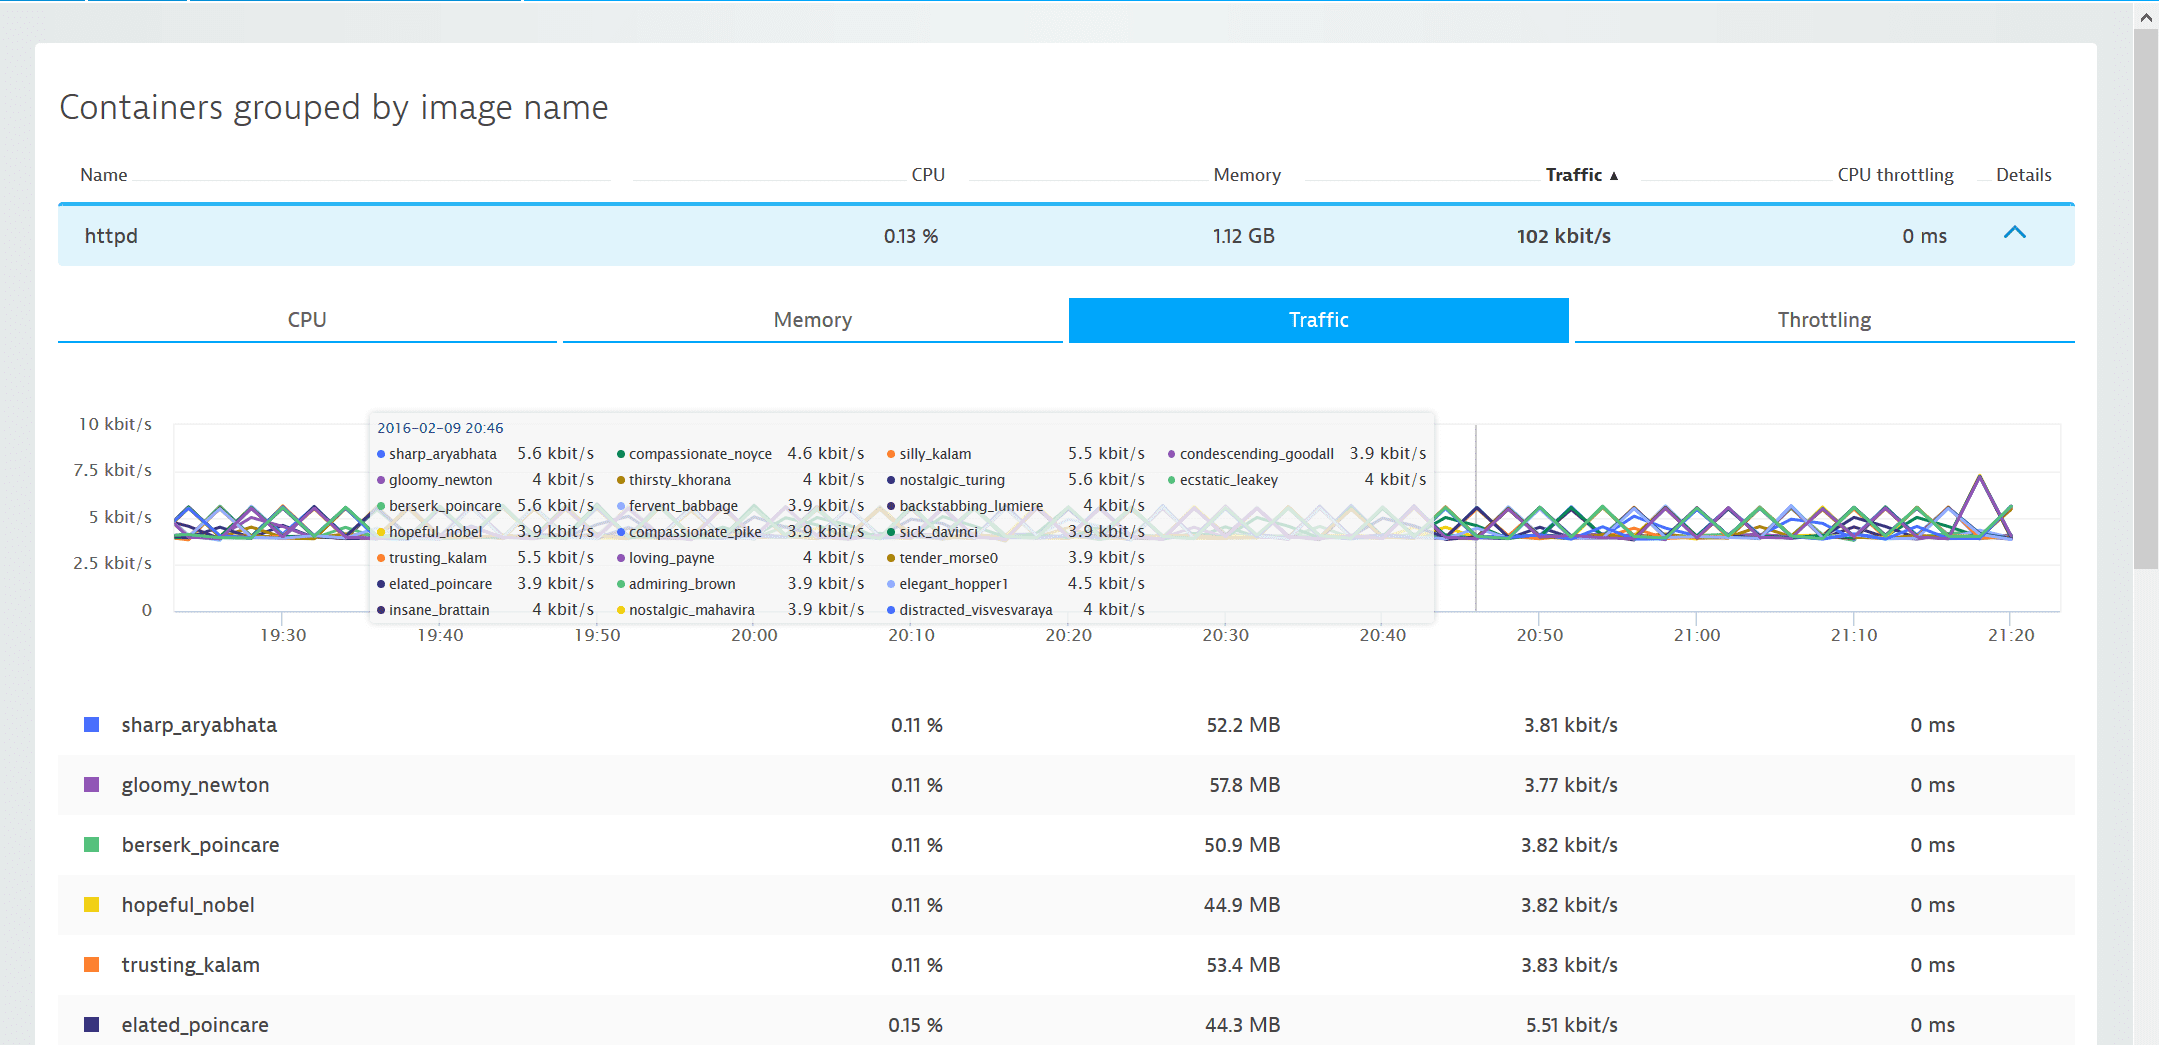
To explore container resource usage, click a host in the Docker host list and then click View containers. This is information you could otherwise only get by executing a docker stats command.
On the Containers page you’ll see all containers of the same image running on the same host that are consuming the most resources.
Provided metrics include:
- CPU: CPU user divided by CPU system, expressed as a percentage.
- Memory: Resident Set Size (RSS) and cache memory. RSS reflects data belonging to processes, while cache memory represents the data stored on disk that is currently cached in memory.
- Traffic: Both incoming and outgoing network traffic
- Throttling: Total time that a container’s CPU usage was throttled
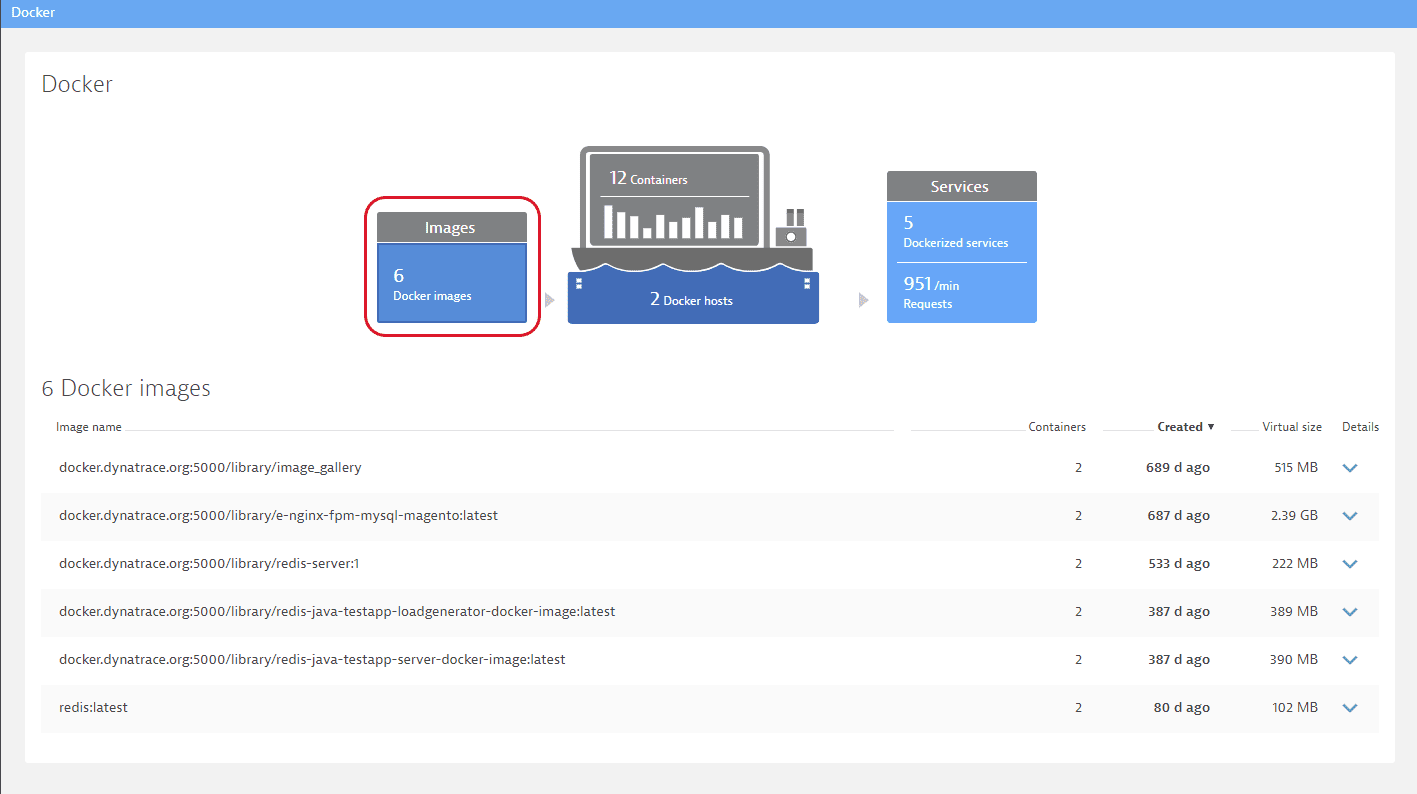
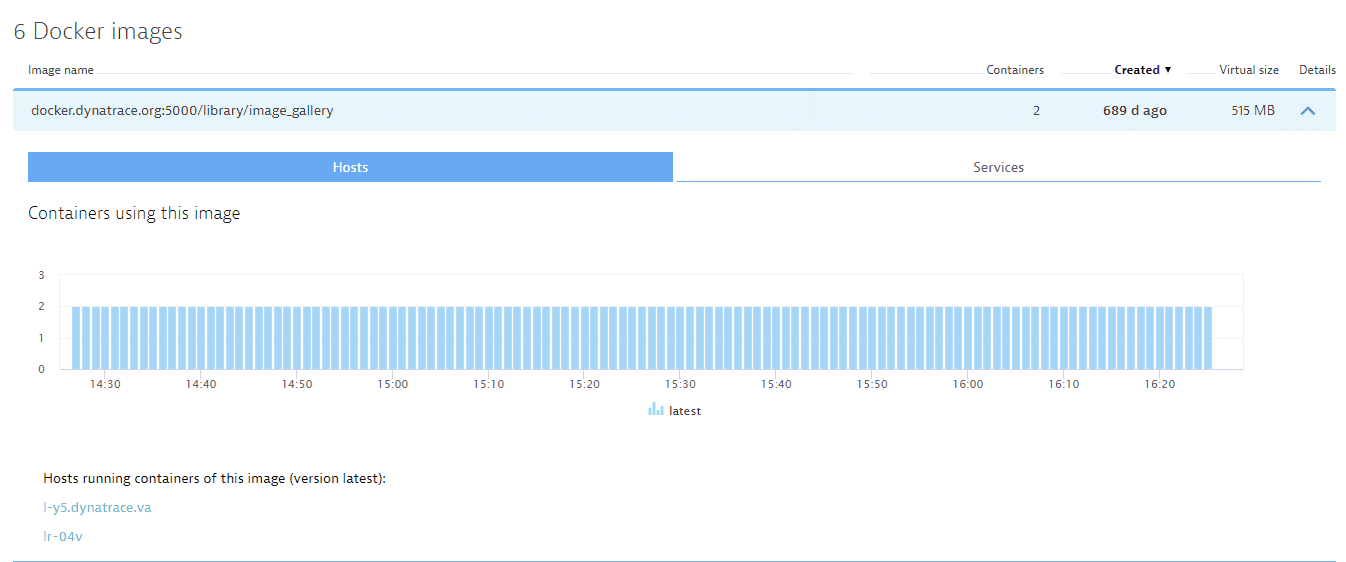
Monitor Docker images
In large environments it can be a challenge to keep up with image versions deployed across hosts and to track the containers of a certain image version. The Docker images page makes it easy to identify hosts running containers of a specific image version. Here you can learn details such as when an image was created and its virtual size (cumulative space taken up by an image).
Monitor Dockerized services
Another valuable perspective is the Dockerized services page. Here you can view all Dockerized services in a list that includes insights into the load and response time of each service. You can correlate these metrics with the number of containers used to provide each service.
Running Docker on AWS Elastic Beanstalk?
Have a look at our guidelines for configuring monitoring for Linux.
Limitations
There are performance limitations related to the number of running containers. The total number of containers that can be monitored in parallel isn't strictly defined though; this depends on the type of monitored applications and host resources.