
The availability of your services and important processes is one of the most important things to consider when monitoring your environment. Simply alerting you each time a process stops wouldn’t be helpful though because some process stops are intentional and don’t represent availability issues.
As always, we at Dynatrace strive to solve monitoring challenges with intelligent solutions that don’t require manual configuration on your end. We asked ourselves what conditions we would consider when determining if the unavailability or crash of a service or process justified receiving an alert. The determining factor, of course, is whether or not your website or other services are impacted by the interruption. So this is exactly how we designed alerting for availability monitoring.
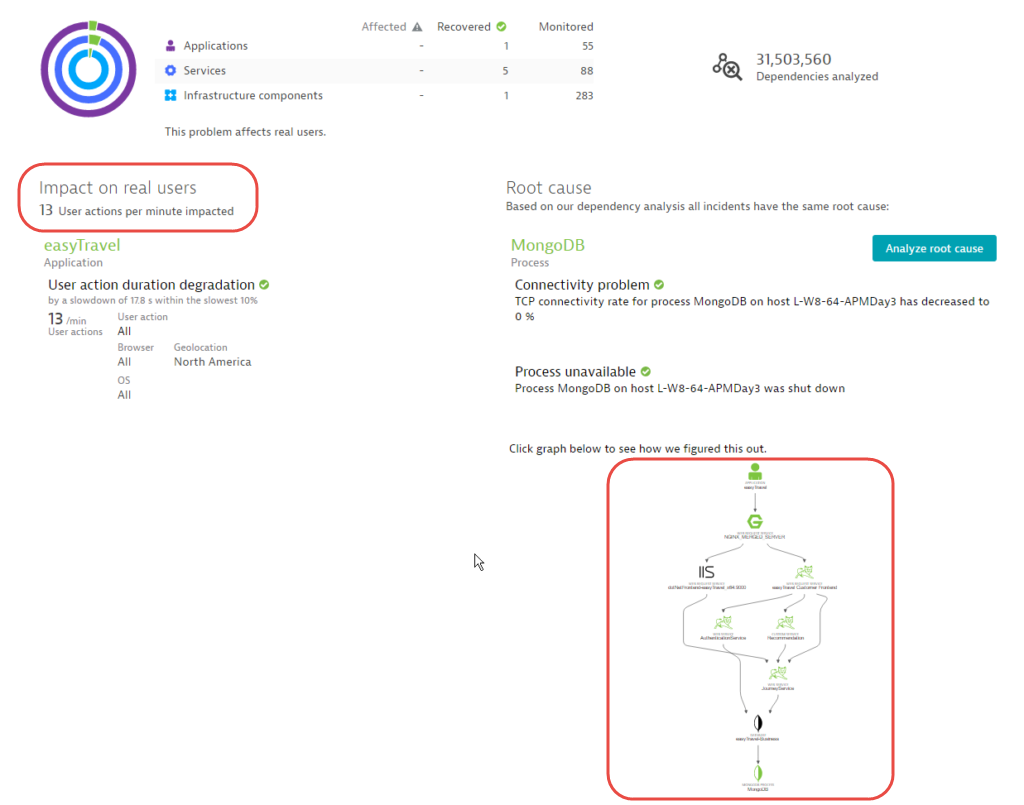
Have a look at the screenshot below. In this particular scenario, someone mistakenly stopped the MongoDB. The result is that the services that are dependent on the MongoDB process are experiencing high failure rates. Rather than alerting you to the fact that the services are experiencing problems, or that the database calls are failing, Dynatrace automatically identifies the root cause of all these issues for you: these issues are the result of the MongoDB database being unavailable.

What’s really impressive is that this type of root cause analysis is available for far more than direct calls—Dynatrace artificial intelligence correlates all events and transactions end-to-end and therefore knows the full impact that unavailability problems have on your system. In the example below you can see the process dependencies visualized in the lower right-hand corner.
Dynatrace even notifies you when end users are affected by availability problems. In the example below, note that the shutdown of MongoDB eventually led to a measurable impact on the end users of the easyTravel web application.
This functionality is currently available for all processes that host services monitored by Dynatrace, including web request services, databases, and all other service types. Plus, further enhancements are on the way!
Traffic drops and global Outages
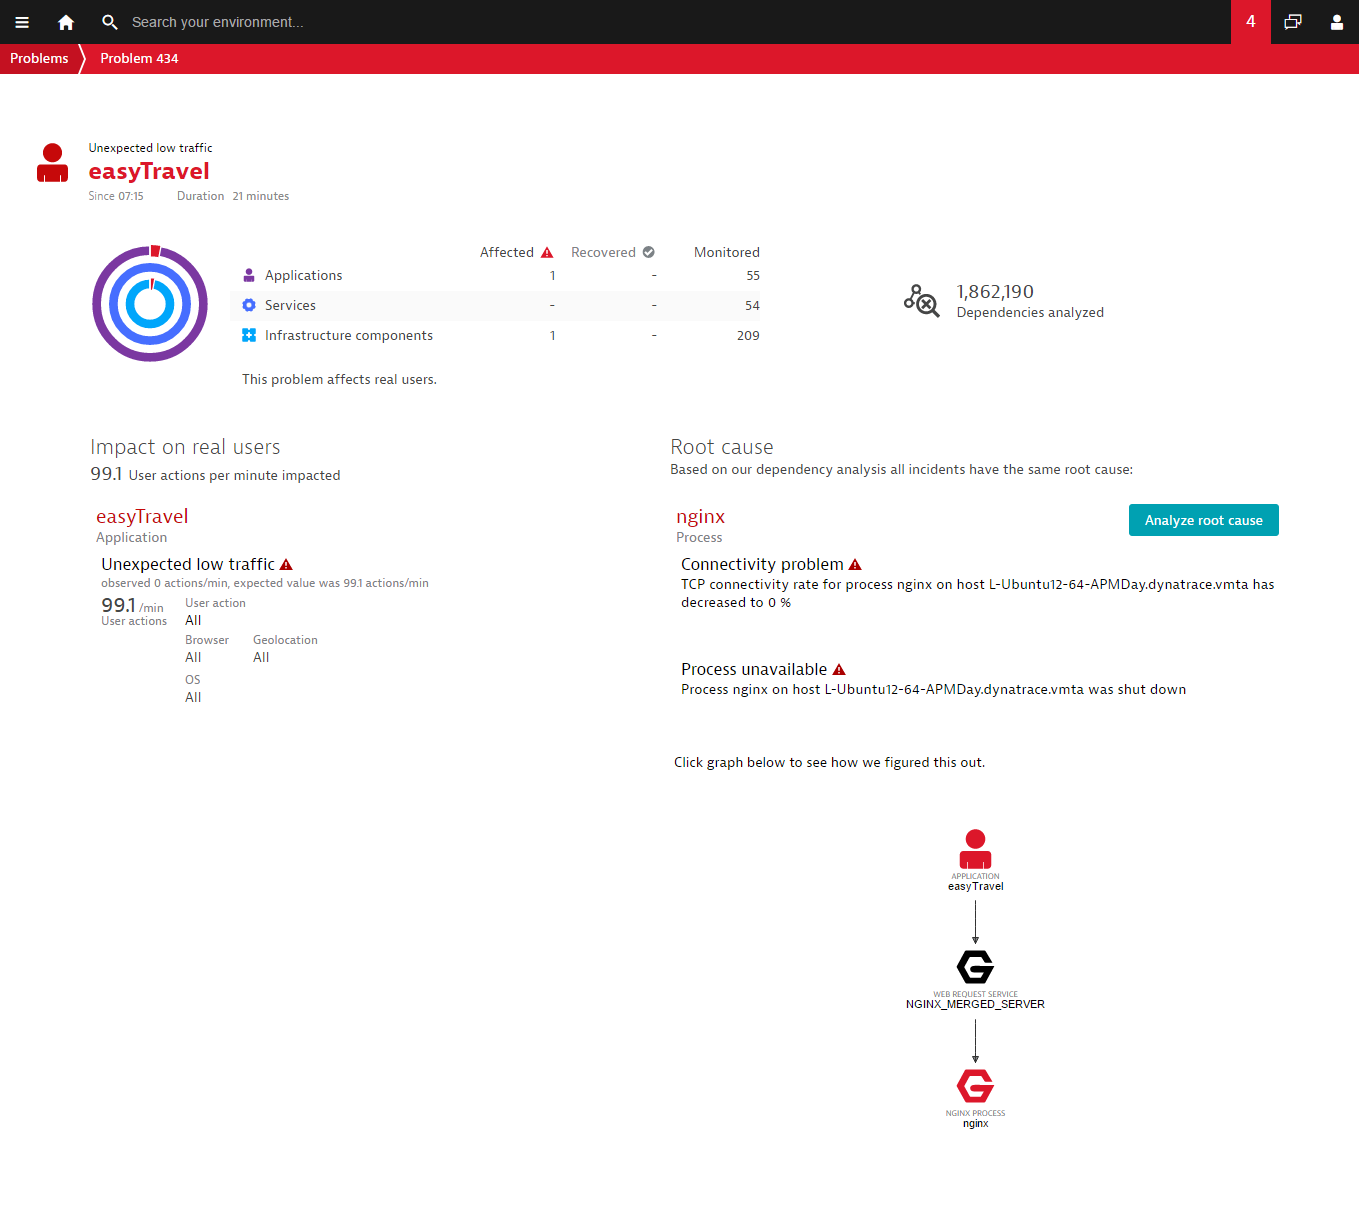
Imagine for a moment that your site’s web server goes down. The obvious consequence of this is that all or some portion of your website is no longer reachable (i.e., your customers can’t visit your website!). While Dynatrace has long been able to detect and report such issues via web checks and real user monitoring, Dynatrace can now additionally identify the underlying root causes of such issues.
In the example below note that Dynatrace has identified the offline Nginx process as the root cause of the unexpected drop in user traffic.


Looking for answers?
Start a new discussion or ask for help in our Q&A forum.
Go to forum