We’re happy to announce the release of Dynatrace ActiveMQ monitoring! ActiveMQ server monitoring provides information about queues, brokers, and more. You’ll know immediately when your ActiveMQ nodes are underperforming. And when problems occur, it’s easy to find out why.
How to view ActiveMQ monitoring insights</h2
Click Technologies in the navigation menu.
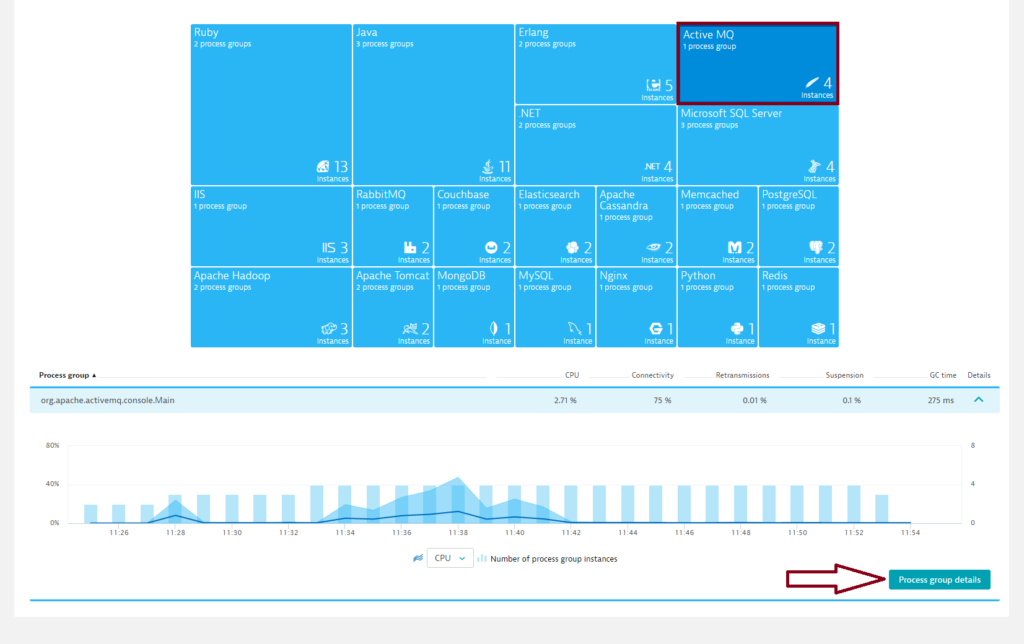
Click the ActiveMQtile on the Technology overview page. Note: Monitoring of multiple ActiveMQ clusters isn’t supported in this beta release.
To view cluster metrics, expand the Details section of the ActiveMQprocess group.
Click the Process group details button.
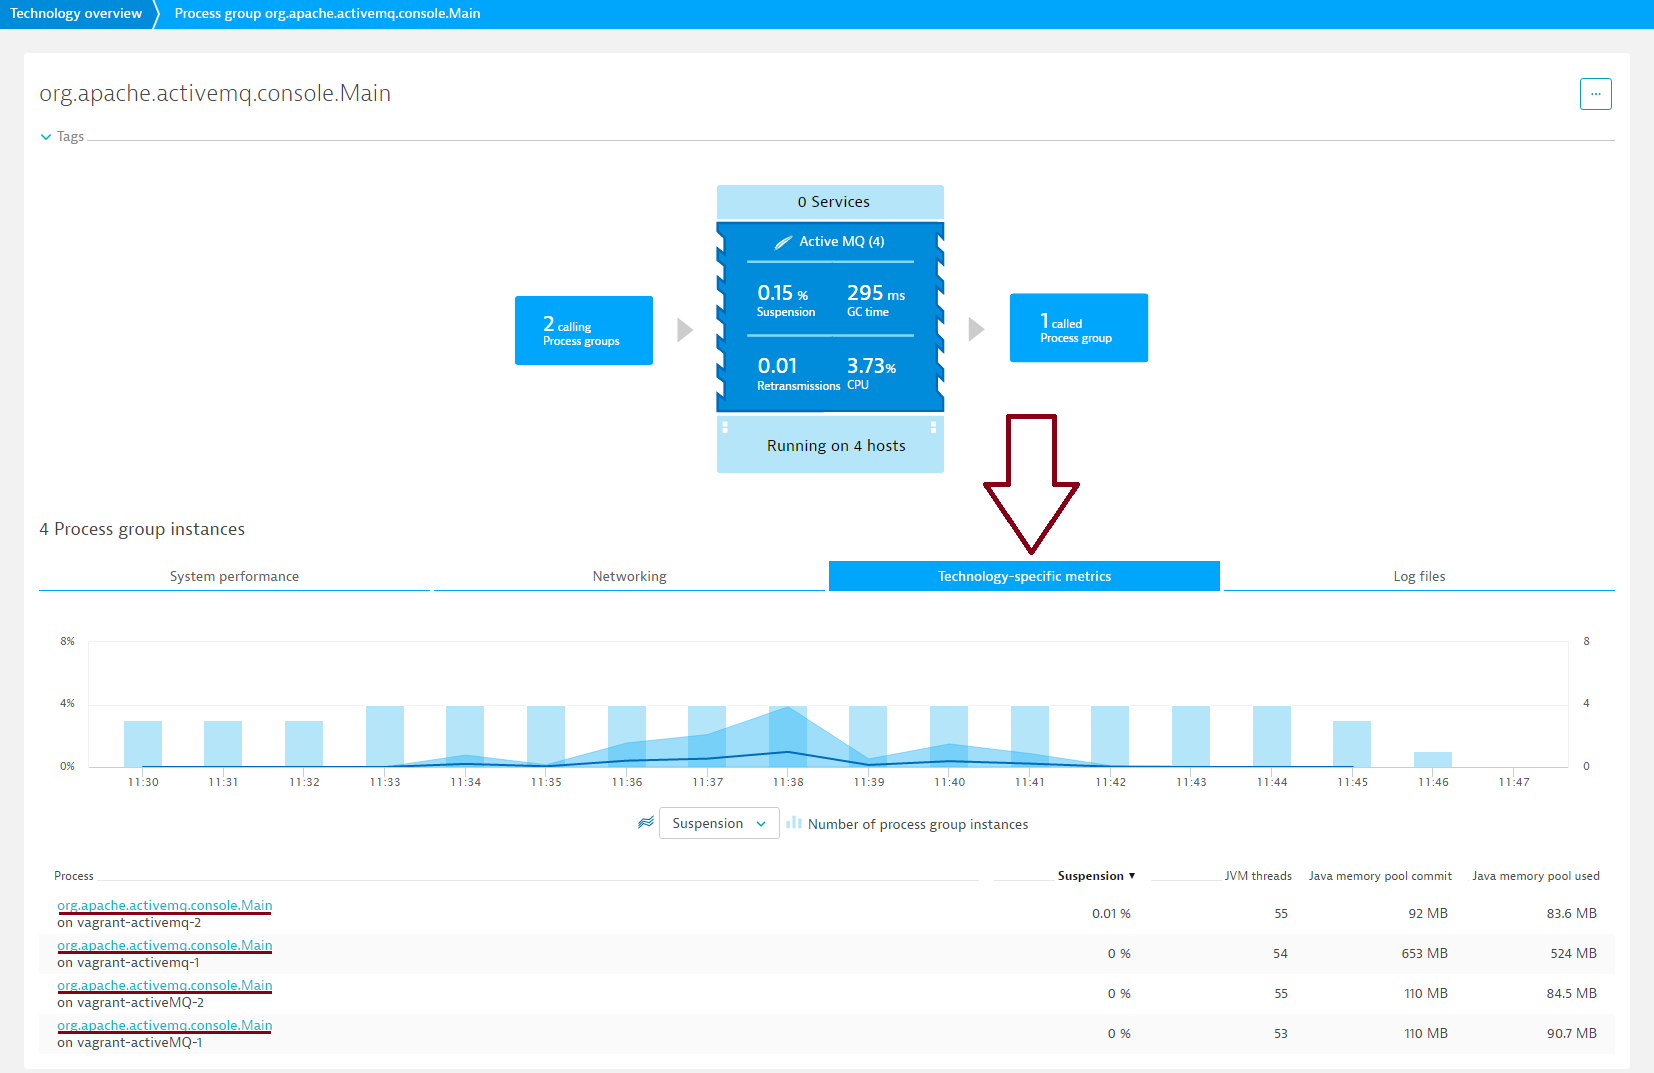
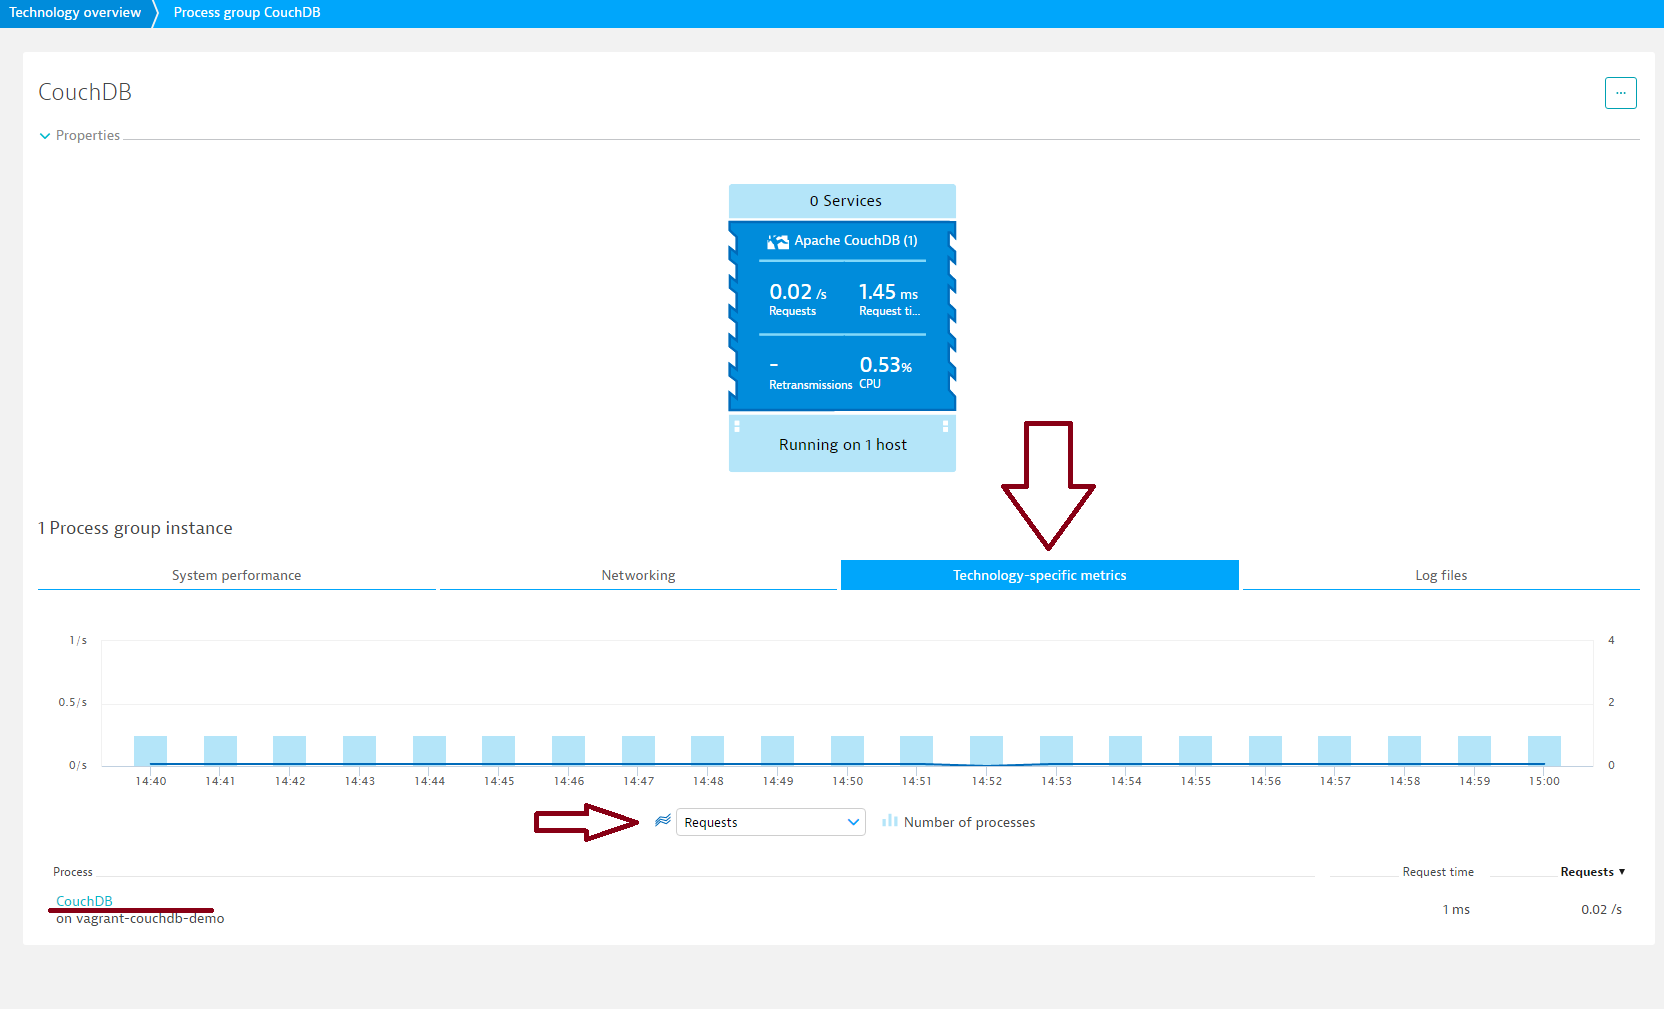
On the Process group details page, select the Technology-specific metrics tab. Here you can identify any problematic nodes.
To access node-specific metrics, select a node from the Process list at the bottom of the page. Drill down into the metrics of individual nodes to find the root causes of any potential bottlenecks or detected problems.
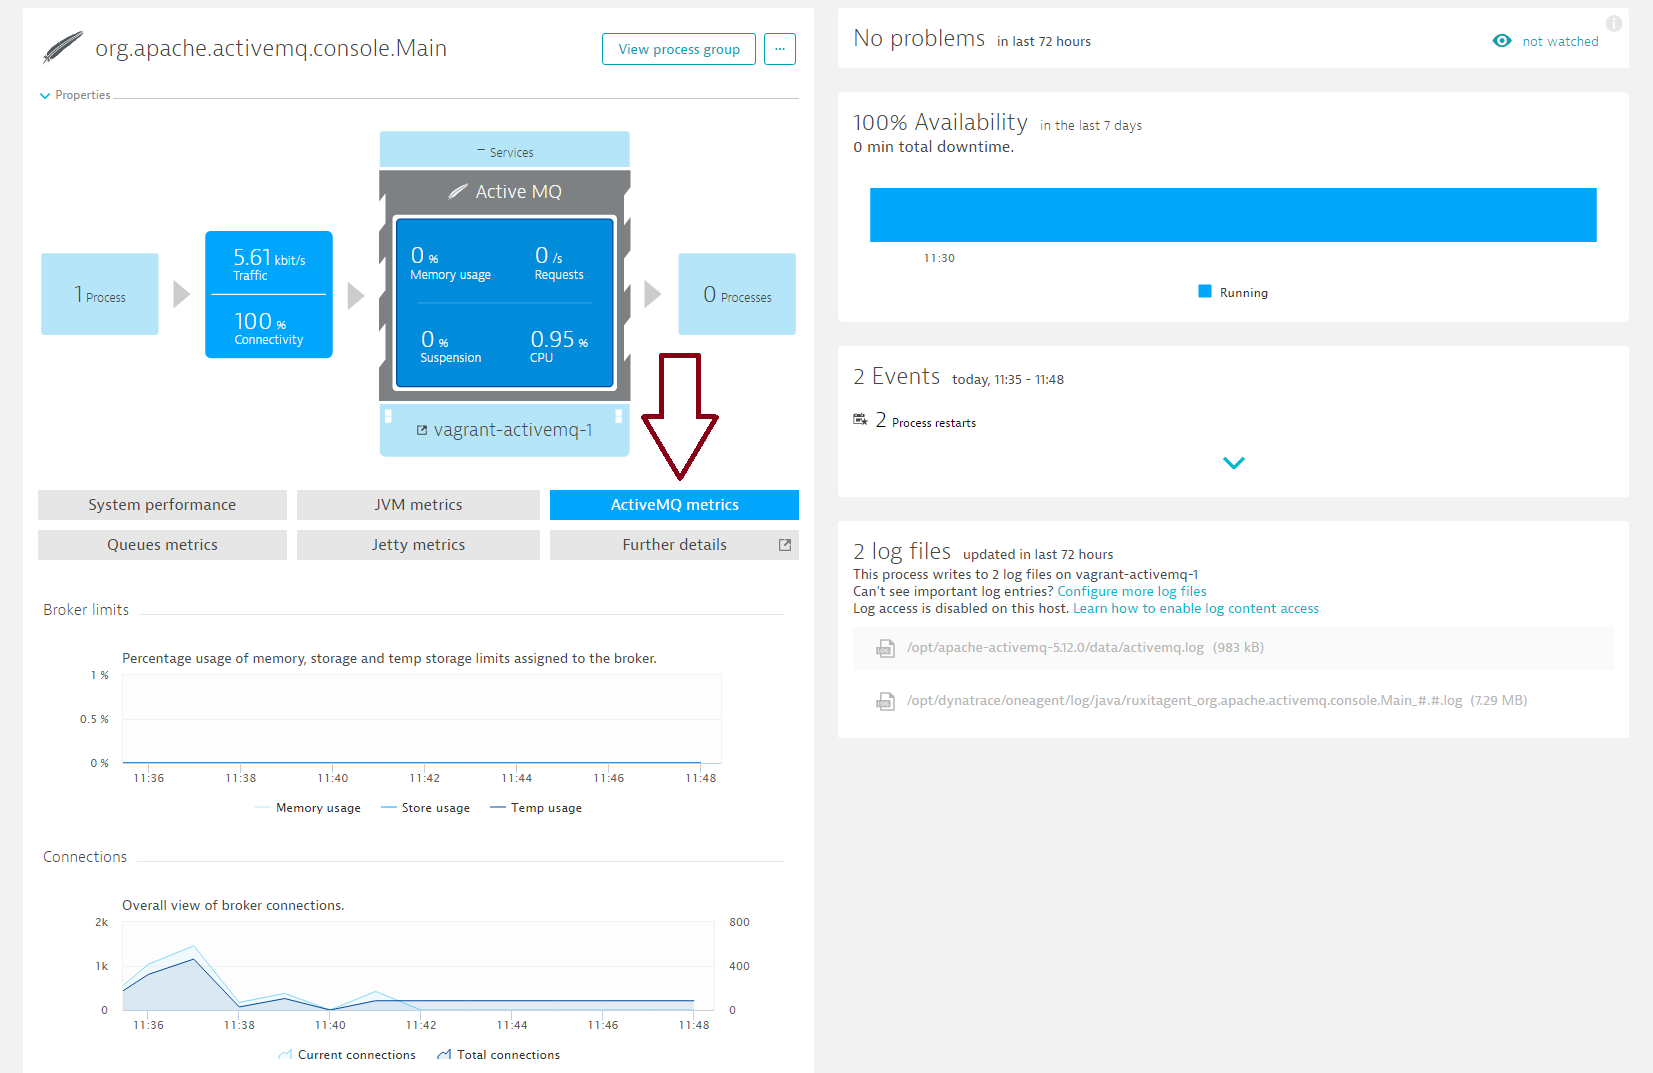
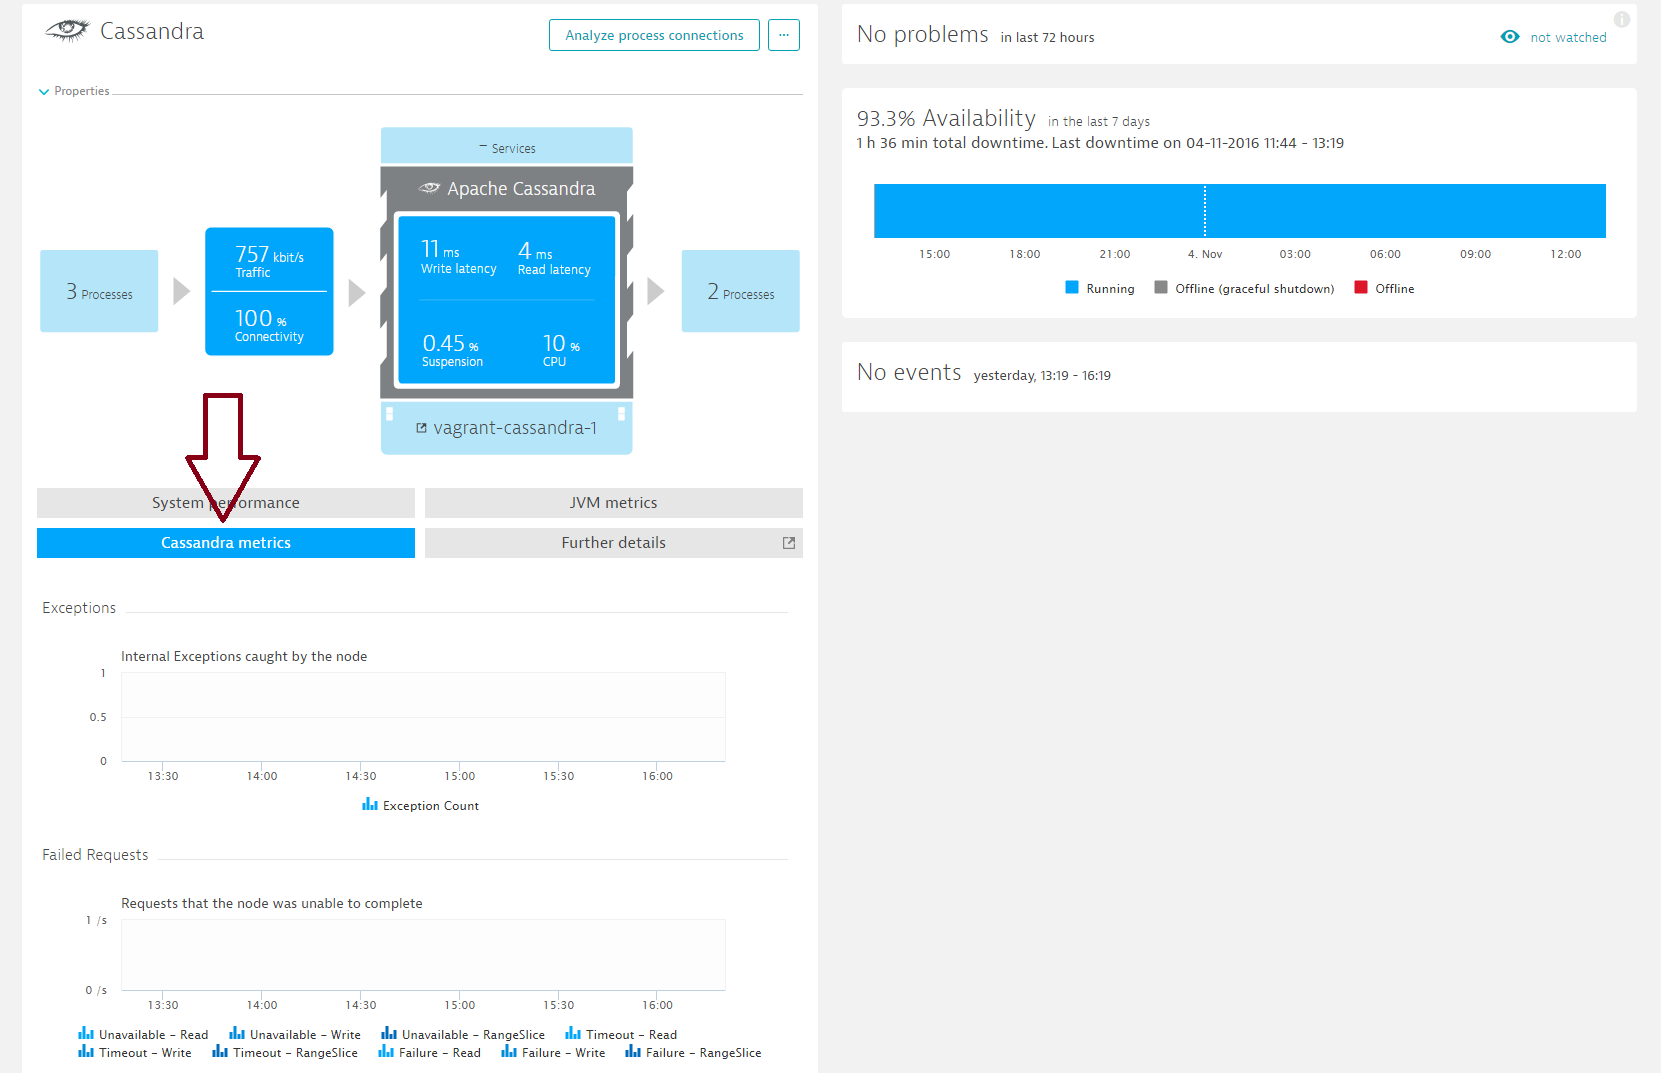
Click the AcitveMQmetrics tab.
Here you’ll find valuable ActiveMQ node-specific metrics. Pay particular attention to the Broker limits chart, which shows memory usage, storage usage, and any temporary storage limits that have been assigned to the broker. Other important metrics include Connections, Number of producers, and Number of consumers.
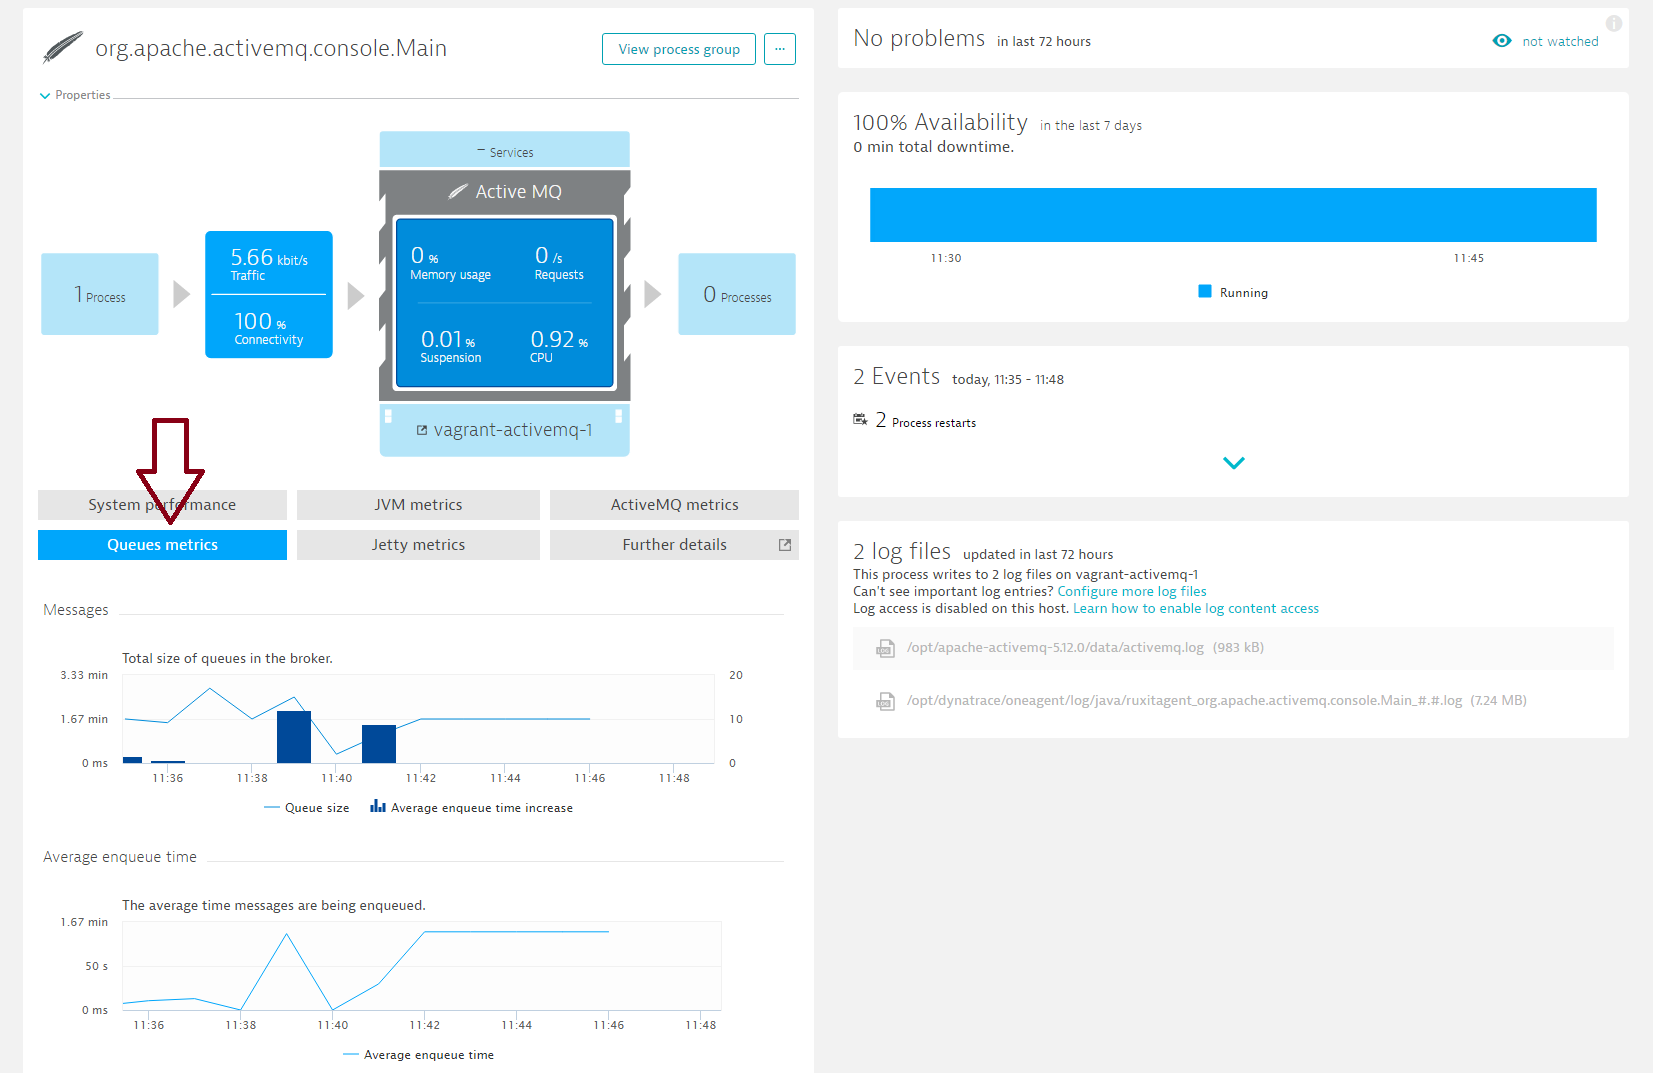
Click the Queues metrics tab. The Queues metrics tab includes all the information you need to know about your queues. Queues size informs you about traffic, Average enqueue time increase informs you about ActiveMQ message processing-time degradation. Please be aware that Average enqueue time is calculated as an average of all messages created since the start of the broker session. When waiting time increases rapidly, this metric changes only slightly. It’s most helpful for trends analysis. For real-time usage, keep an eye on the Average enqueue time increase metric.
ActiveMQ metrics
Metric
Description
Average enqueue time increase
Increase of average enqueue time counted, as delta between samples.
Average enqueue time
Average of time from enqueue to dequeue of messages, given in milliseconds.
(waiting time of messages before they’re consumed)
Memory usage
Percentage usage of memory limit for NON_PERSISTENT messages.
Store usage
Percentage usage of storage limit for PERSISTENT messages.
Temp usage
Percentage usage of storage limit for temporary messages.
Current connections
Number of currently open connections.
Total connections
Number of connections from last broker restart.
Producers
TotalProducerCount
Consumers
TotalConsumerCount
Queue size
Number of messages in the queue/store that haven’t been ack’d by a consumer.
Enqueue count
Number of messages sent to the queue since the last restart.
Dequeue count
Number of messages removed from the queue (ack’d by consumer) since last restart.
Dispatch count
Number of messages sent to consumer sessions. (Dequeue + Inflight)
Expired count
Number of messages not delivered because they expired.
In Flight count
Number of messages sent to a consumer session that haven’t received an ack.
Prerequisites
Linux OS
ActiveMQ 5.8.0+
Compatible with Docker containers
Dynatrace OneAgent is required on all nodes
Enabled JMX monitoring
Enable ActiveMQ monitoring globally
With ActiveMQ monitoring enabled globally, Dynatrace automatically collects ActiveMQ metrics whenever a new host running ActiveMQ is detected in your environment.
Go to Settings > Monitoring > Monitored technologies.
Set the ActiveMQ JMX switch to On.
Have feedback?
Your feedback about Dynatrace ActiveMQ monitoring is most welcome! Let us know what you think of the new ActiveMQ plugin by adding a comment below. Or post your questions and feedback to Dynatrace Community.


 The Queues metrics tab includes all the information you need to know about your queues. Queues size informs you about traffic, Average enqueue time increase informs you about ActiveMQ message processing-time degradation. Please be aware that Average enqueue time is calculated as an average of all messages created since the start of the broker session. When waiting time increases rapidly, this metric changes only slightly. It’s most helpful for trends analysis. For real-time usage, keep an eye on the Average enqueue time increase metric.


Looking for answers?
Start a new discussion or ask for help in our Q&A forum.
Go to forum