
Memory leaks are well-known problem patterns within application development. There are many tools that can show a memory leak is happening, but very few tools are equipped to provide any level of deep insight into the objects consuming a large majority of RAM. In a recent engagement, I worked with one of our partners to find the object causing a native memory leak, typically one of the hardest things to diagnose! The analysis was extremely impressive, and warrants sharing with a larger audience. What follows is the step-by-step process detailing how a smart tool, and an even smarter user, can find the toughest of root causes for performance problems impacting end users.
Setting the Stage
End user problems suck. It is even worse when there is no way for the production support team to validate issues. In this example, a Citrix based Java client was upgraded to a newer release. After the release was rolled out to a subset of sites, users started to complain about the client freezing intermittently. We needed Visibility into the JVM running the client, and since Dynatrace can monitor any type of transaction (not just web request based transactions), the partner decided to give it a try at one of the sites experiencing the issue.
Uncovering the Issue
We applied the agent to the site, and the team was planning to wait for a user to call in. The environment allowed for users to quickly find a specific user’s client, along with all of the interactions that took place during the session. Almost immediately alarms were triggered and pointed to an out of memory notification being thrown by the Java client JVMs. When the partner looked at the captured heap dump, their heart sank a bit:
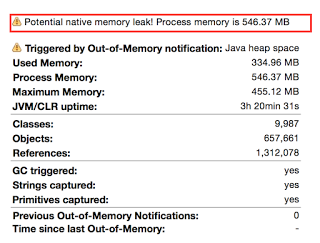 Why was the partner so concerned? Because they know native memory leaks are extremely hard to diagnose. To verify this issue was inline with the production problems, the team was able to call the user who experienced the leak and confirm the client did freeze when the leak was detected. The customer PROACTIVELY captured the end users issue without the end user calling in. Since this was a P1 issue, the partner gritted their teeth and decided to see how far they could go.
Finding the Suspect
Now the partner was on a fact-finding mission. They knew they at least had to understand what was going on in the heap to properly determine next steps. With one click, something very interesting was uncovered:
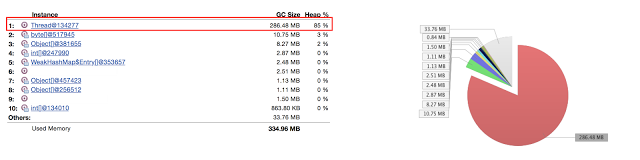
Whoa! One thread object taking up 85% of the heap?! That clearly needed further investigation. This is also a good sign that the partner did not see a whole lot of custom objects taking up a majority of heap space. There were still a few more things to see, so the partner decided to focus on this specific thread.
Pulling on the Loose Thread
What could the partner do next? Well if that thread is taking up the majority of heap, the logical next step is to determine what makes up that thread. Looking at the objects still referenced by the thread provided that insight:

Thousands of references to a JNI object type! This type of understanding is what separates the pros from the amateurs (take a look at this article for more information on JNI). JNI stands for Java Native Interface and these are the objects that can send requests to native components. These are also often the ways that a custom application can communicate with a driver or device. Although the JNI objects themselves are small (24 bytes) they could be referencing native objects that are much bigger.
Calling Their Baby Ugly (With Proof)
I have never met anyone who wants to be wrong. This is why triage sessions often end up with hurt feelings and strained relationships. However, in this instance the partner was able to change the conversation from “the app is broken” to “there is a native memory leak that is caused by a reference to this particular JNI object”. This is a data driven dialogue where no emotion is involved, simply facts. This analysis is what I consider root cause. The vendor knows exactly what to change for a resolution and not simply that there is a problem “somewhere in the stack”.


Looking for answers?
Start a new discussion or ask for help in our Q&A forum.
Go to forum