
We’re happy to announce full support for deep monitoring of applications running in Google App Engine flexible environment. Google App Engine (GAE) flexible environment allows you to run your custom Docker images on Google’s managed application platform.
To get a clear picture of your applications’ performance in GAE, and how those applications interact with the rest of your multi-cloud stack (like Kubernetes), you need a solution that provides you with a single pane of glass for all your application workloads, across cloud environments.
Understand application performance
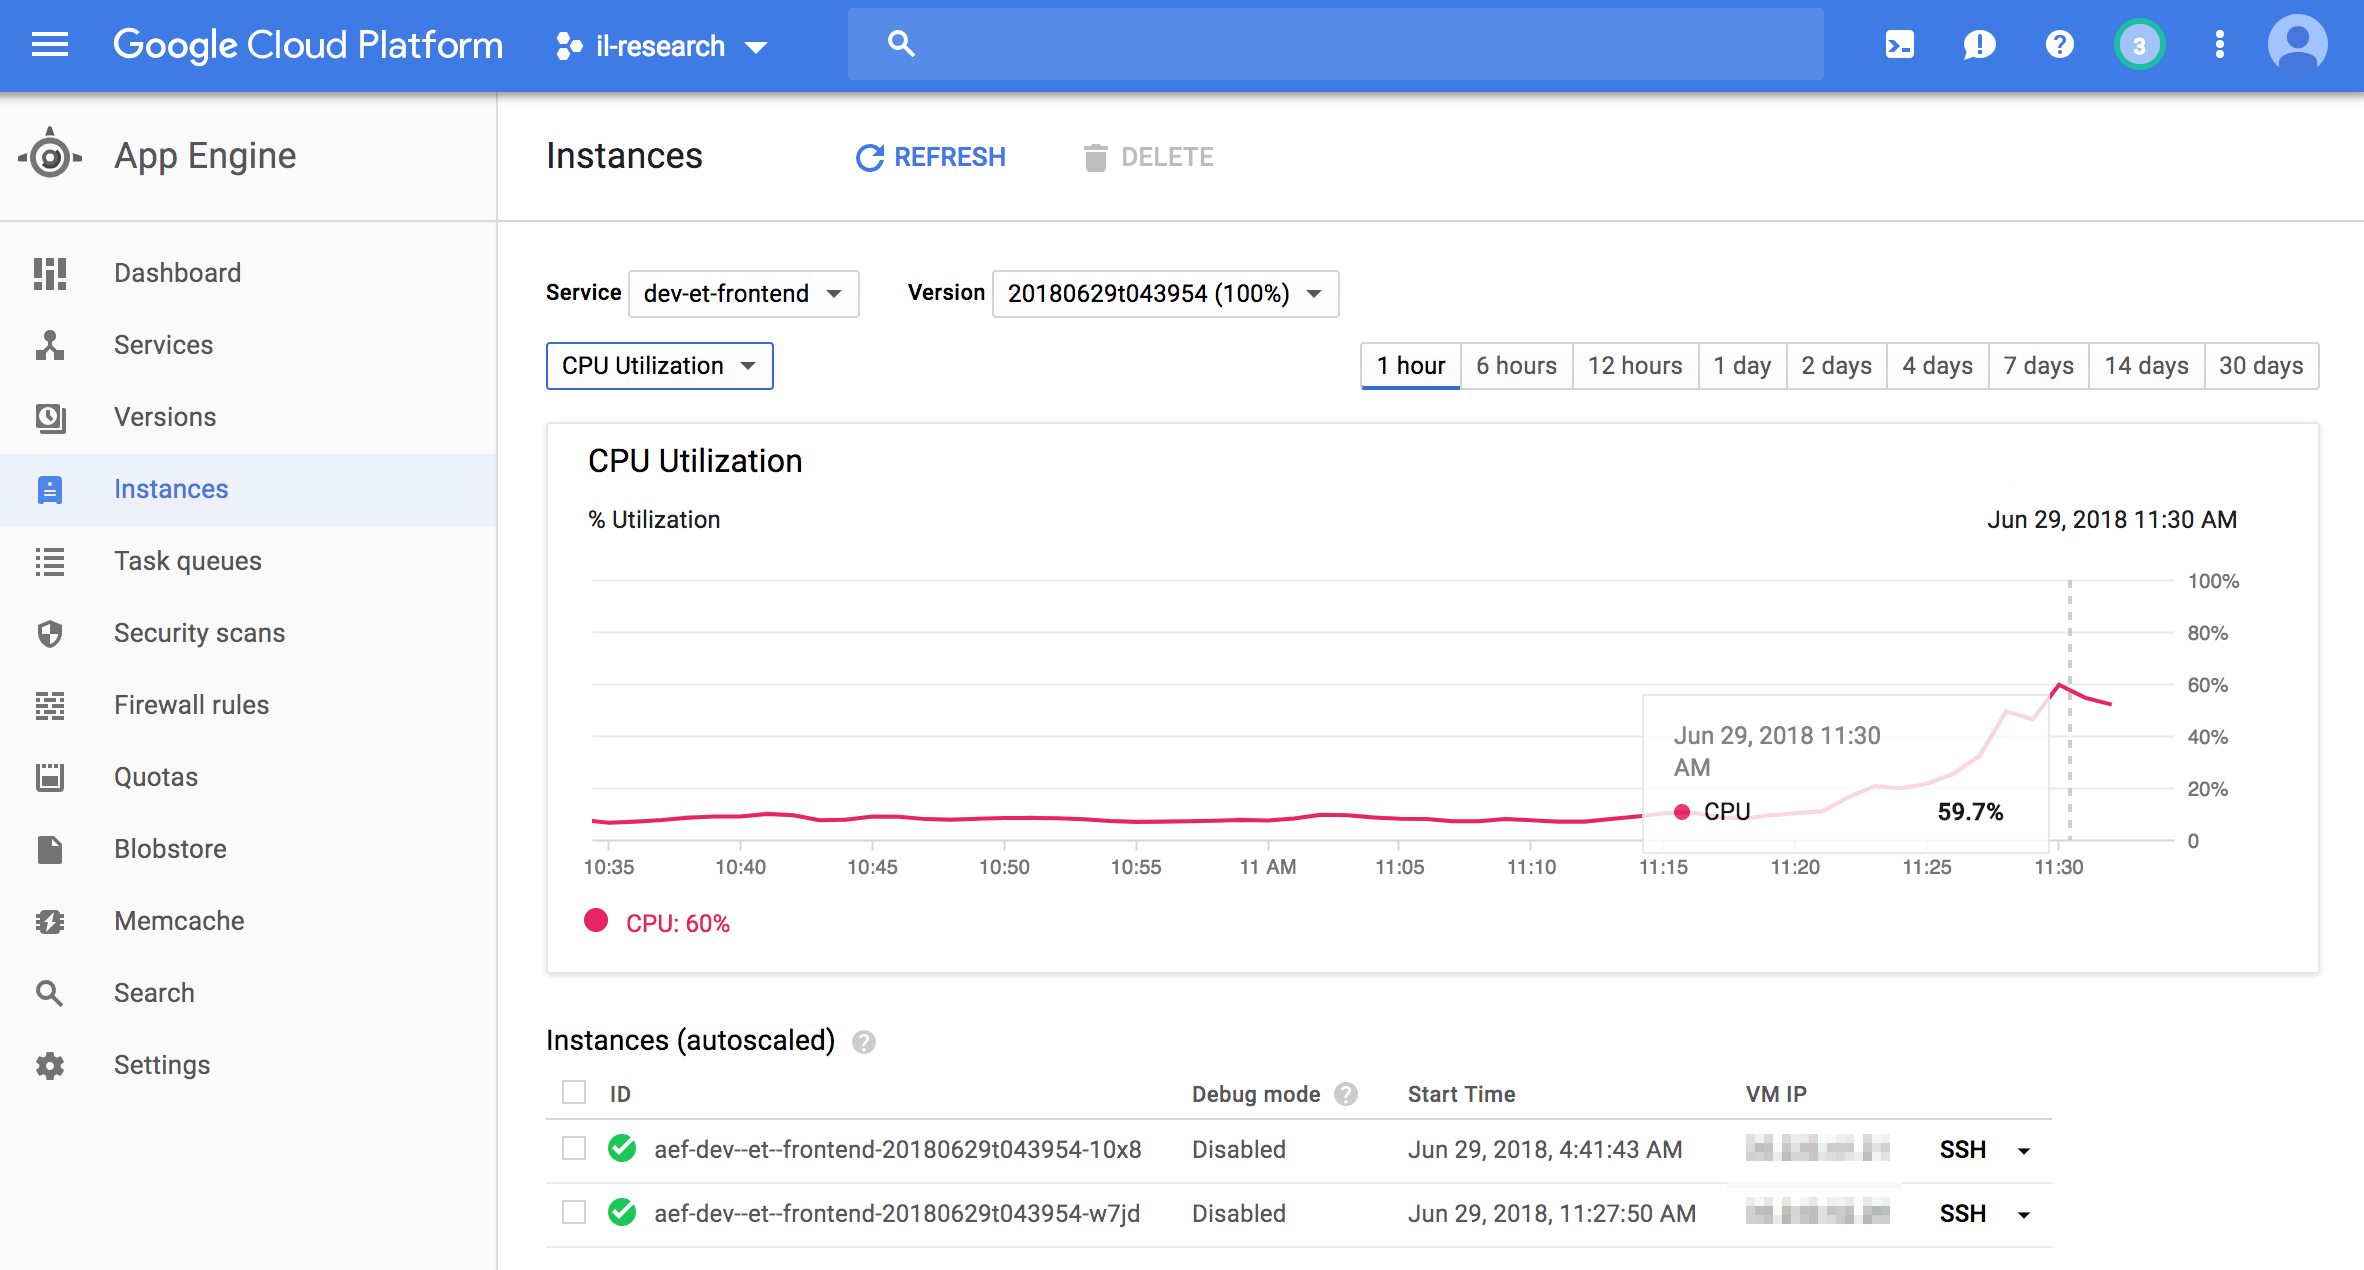
Managed cloud platforms typically provide customers with only a rough understanding of the performance of their deployed applications. Such a black-box monitoring approach usually provides basic metrics related to CPU utilization, memory usage, and network traffic.
If you care about the performance of your applications, you need white-box monitoring that allows you to understand the internal state of your application. Having such insight into your applications is key to not only learning about the performance of your applications, but also to automatically detecting severe issues, troubleshooting failures, improving response times, and optimizing code.
Example: Increased response time & high failure rate
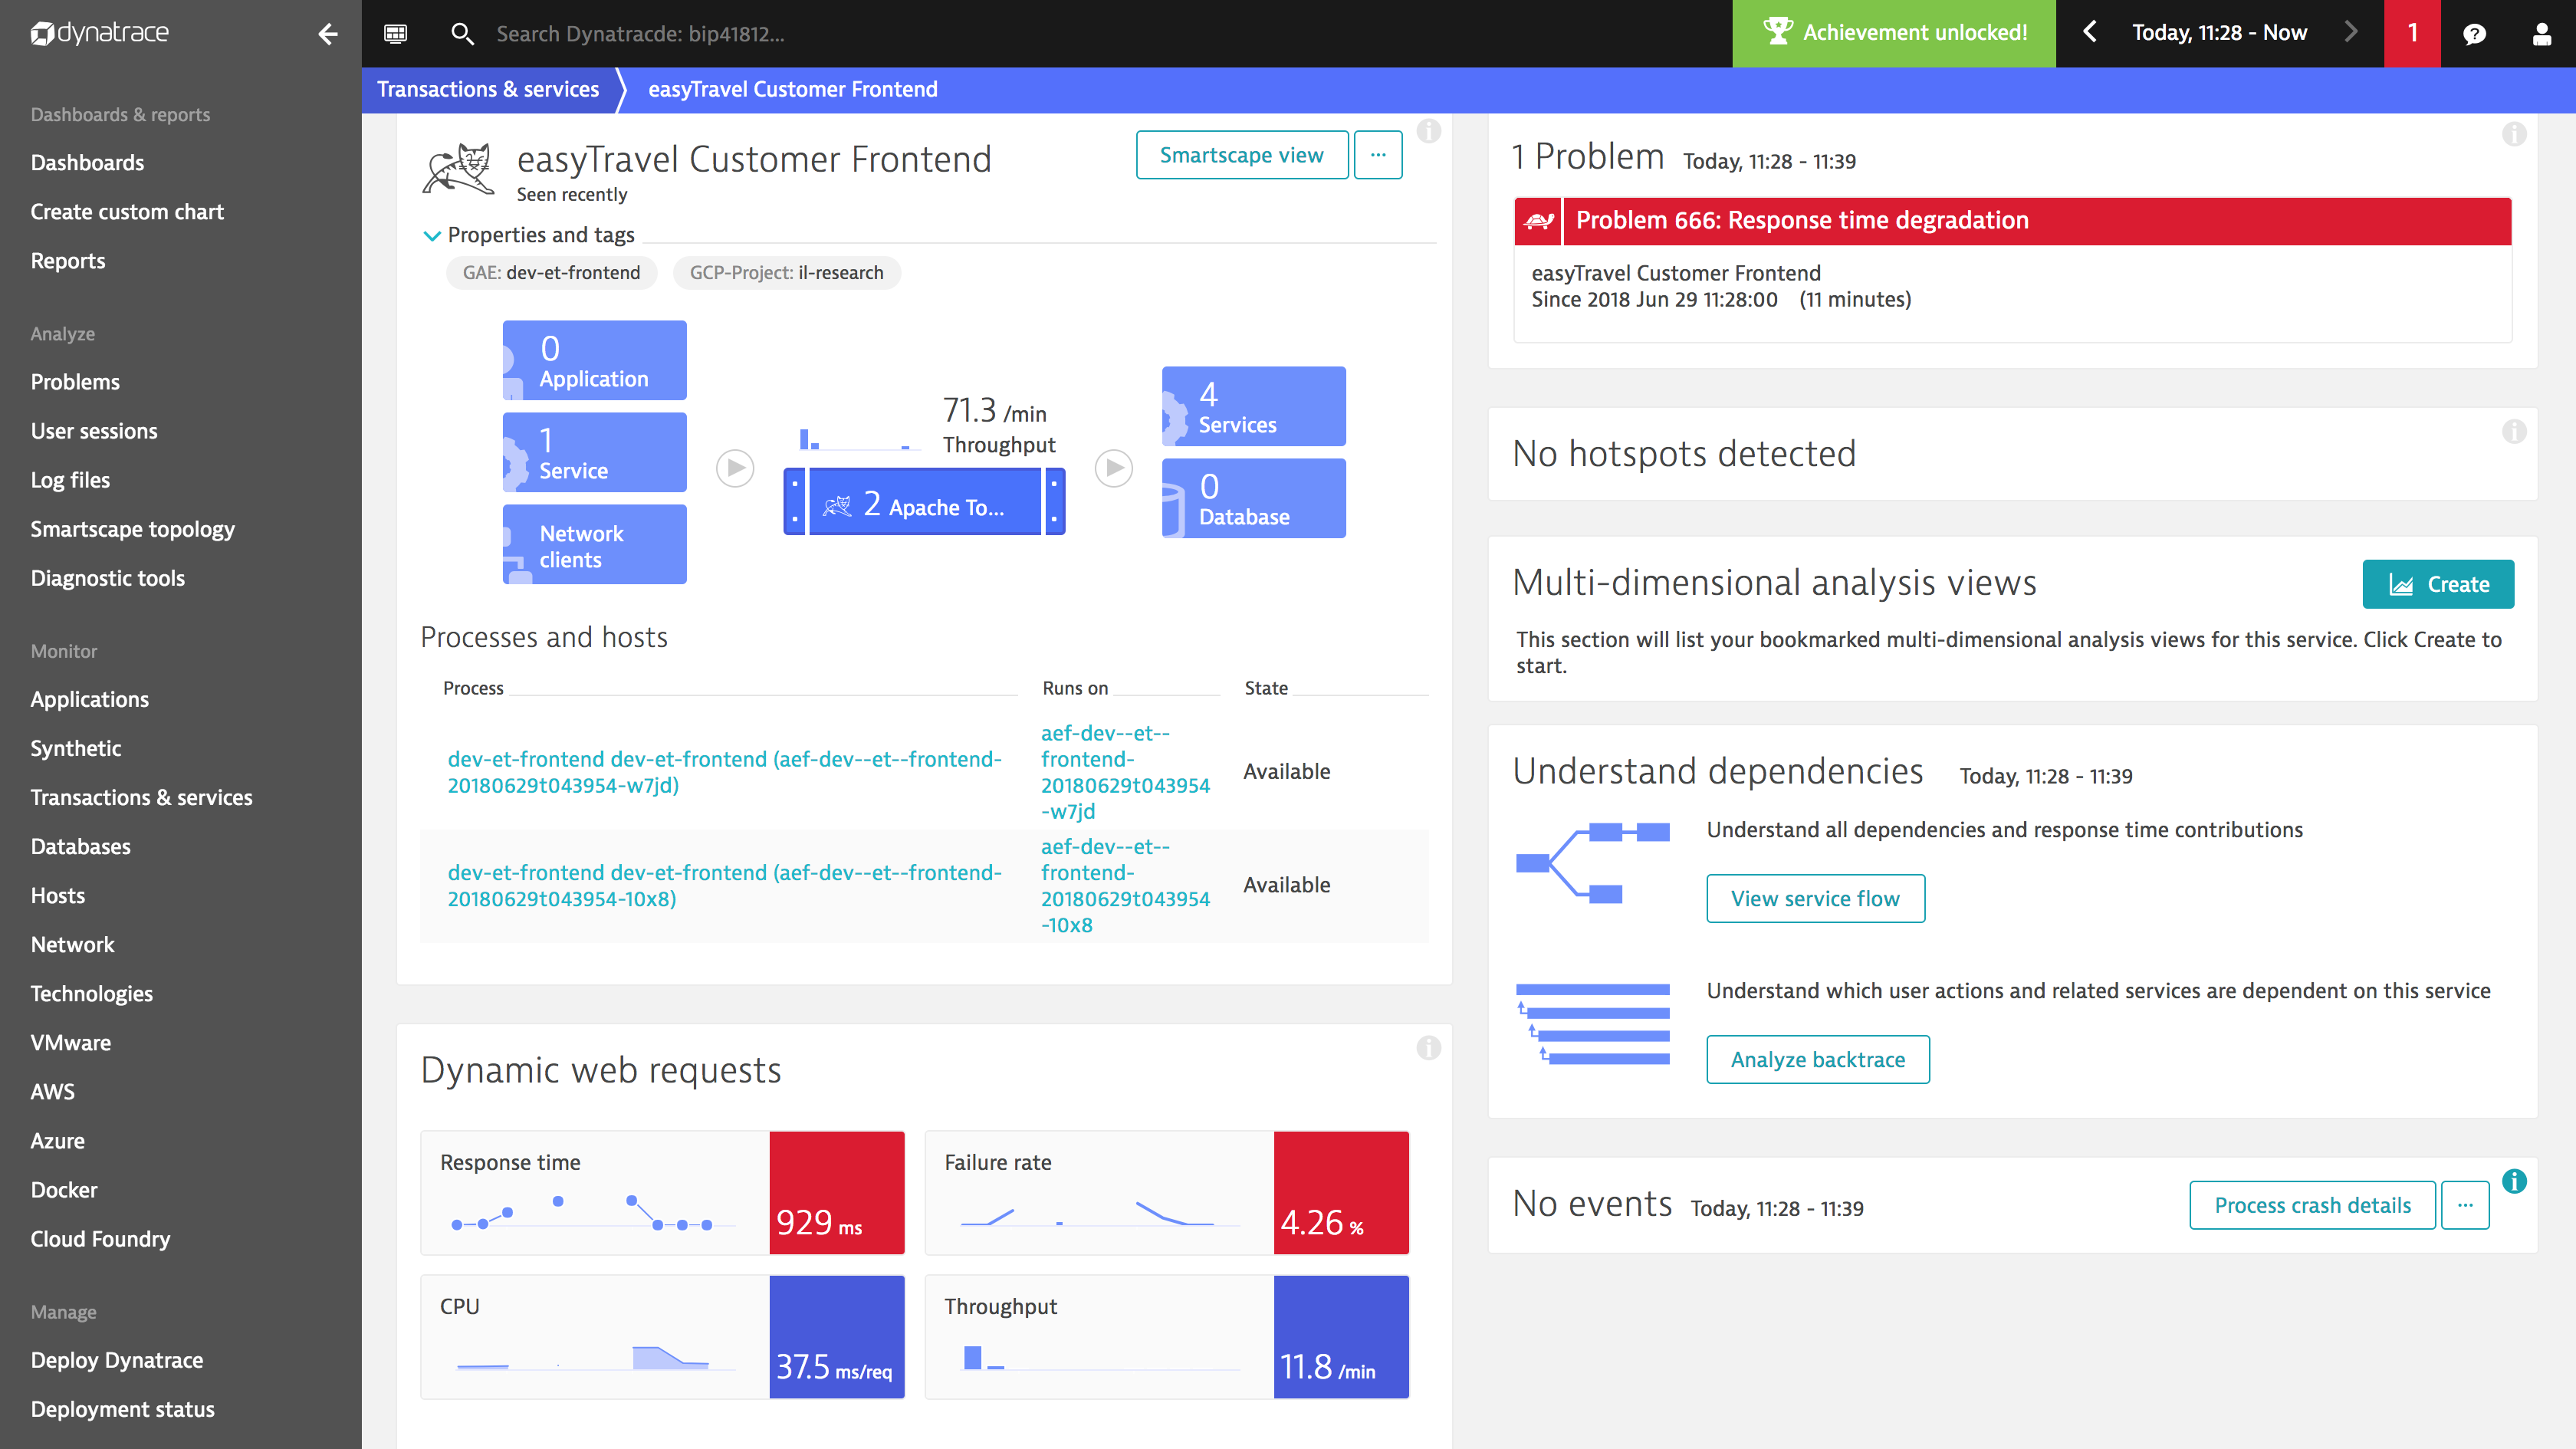
In the example scenario below we ran containerized workloads in two different GAE services, one serving an application frontend and another serving the backend. One of the obvious advantages of running applications on Google App Engine is that the platform takes care of failover and automatic scaling of applications. In this example, Dynatrace detected a massive increase in the response time of the frontend service, which was followed by a high failure rate for the service.
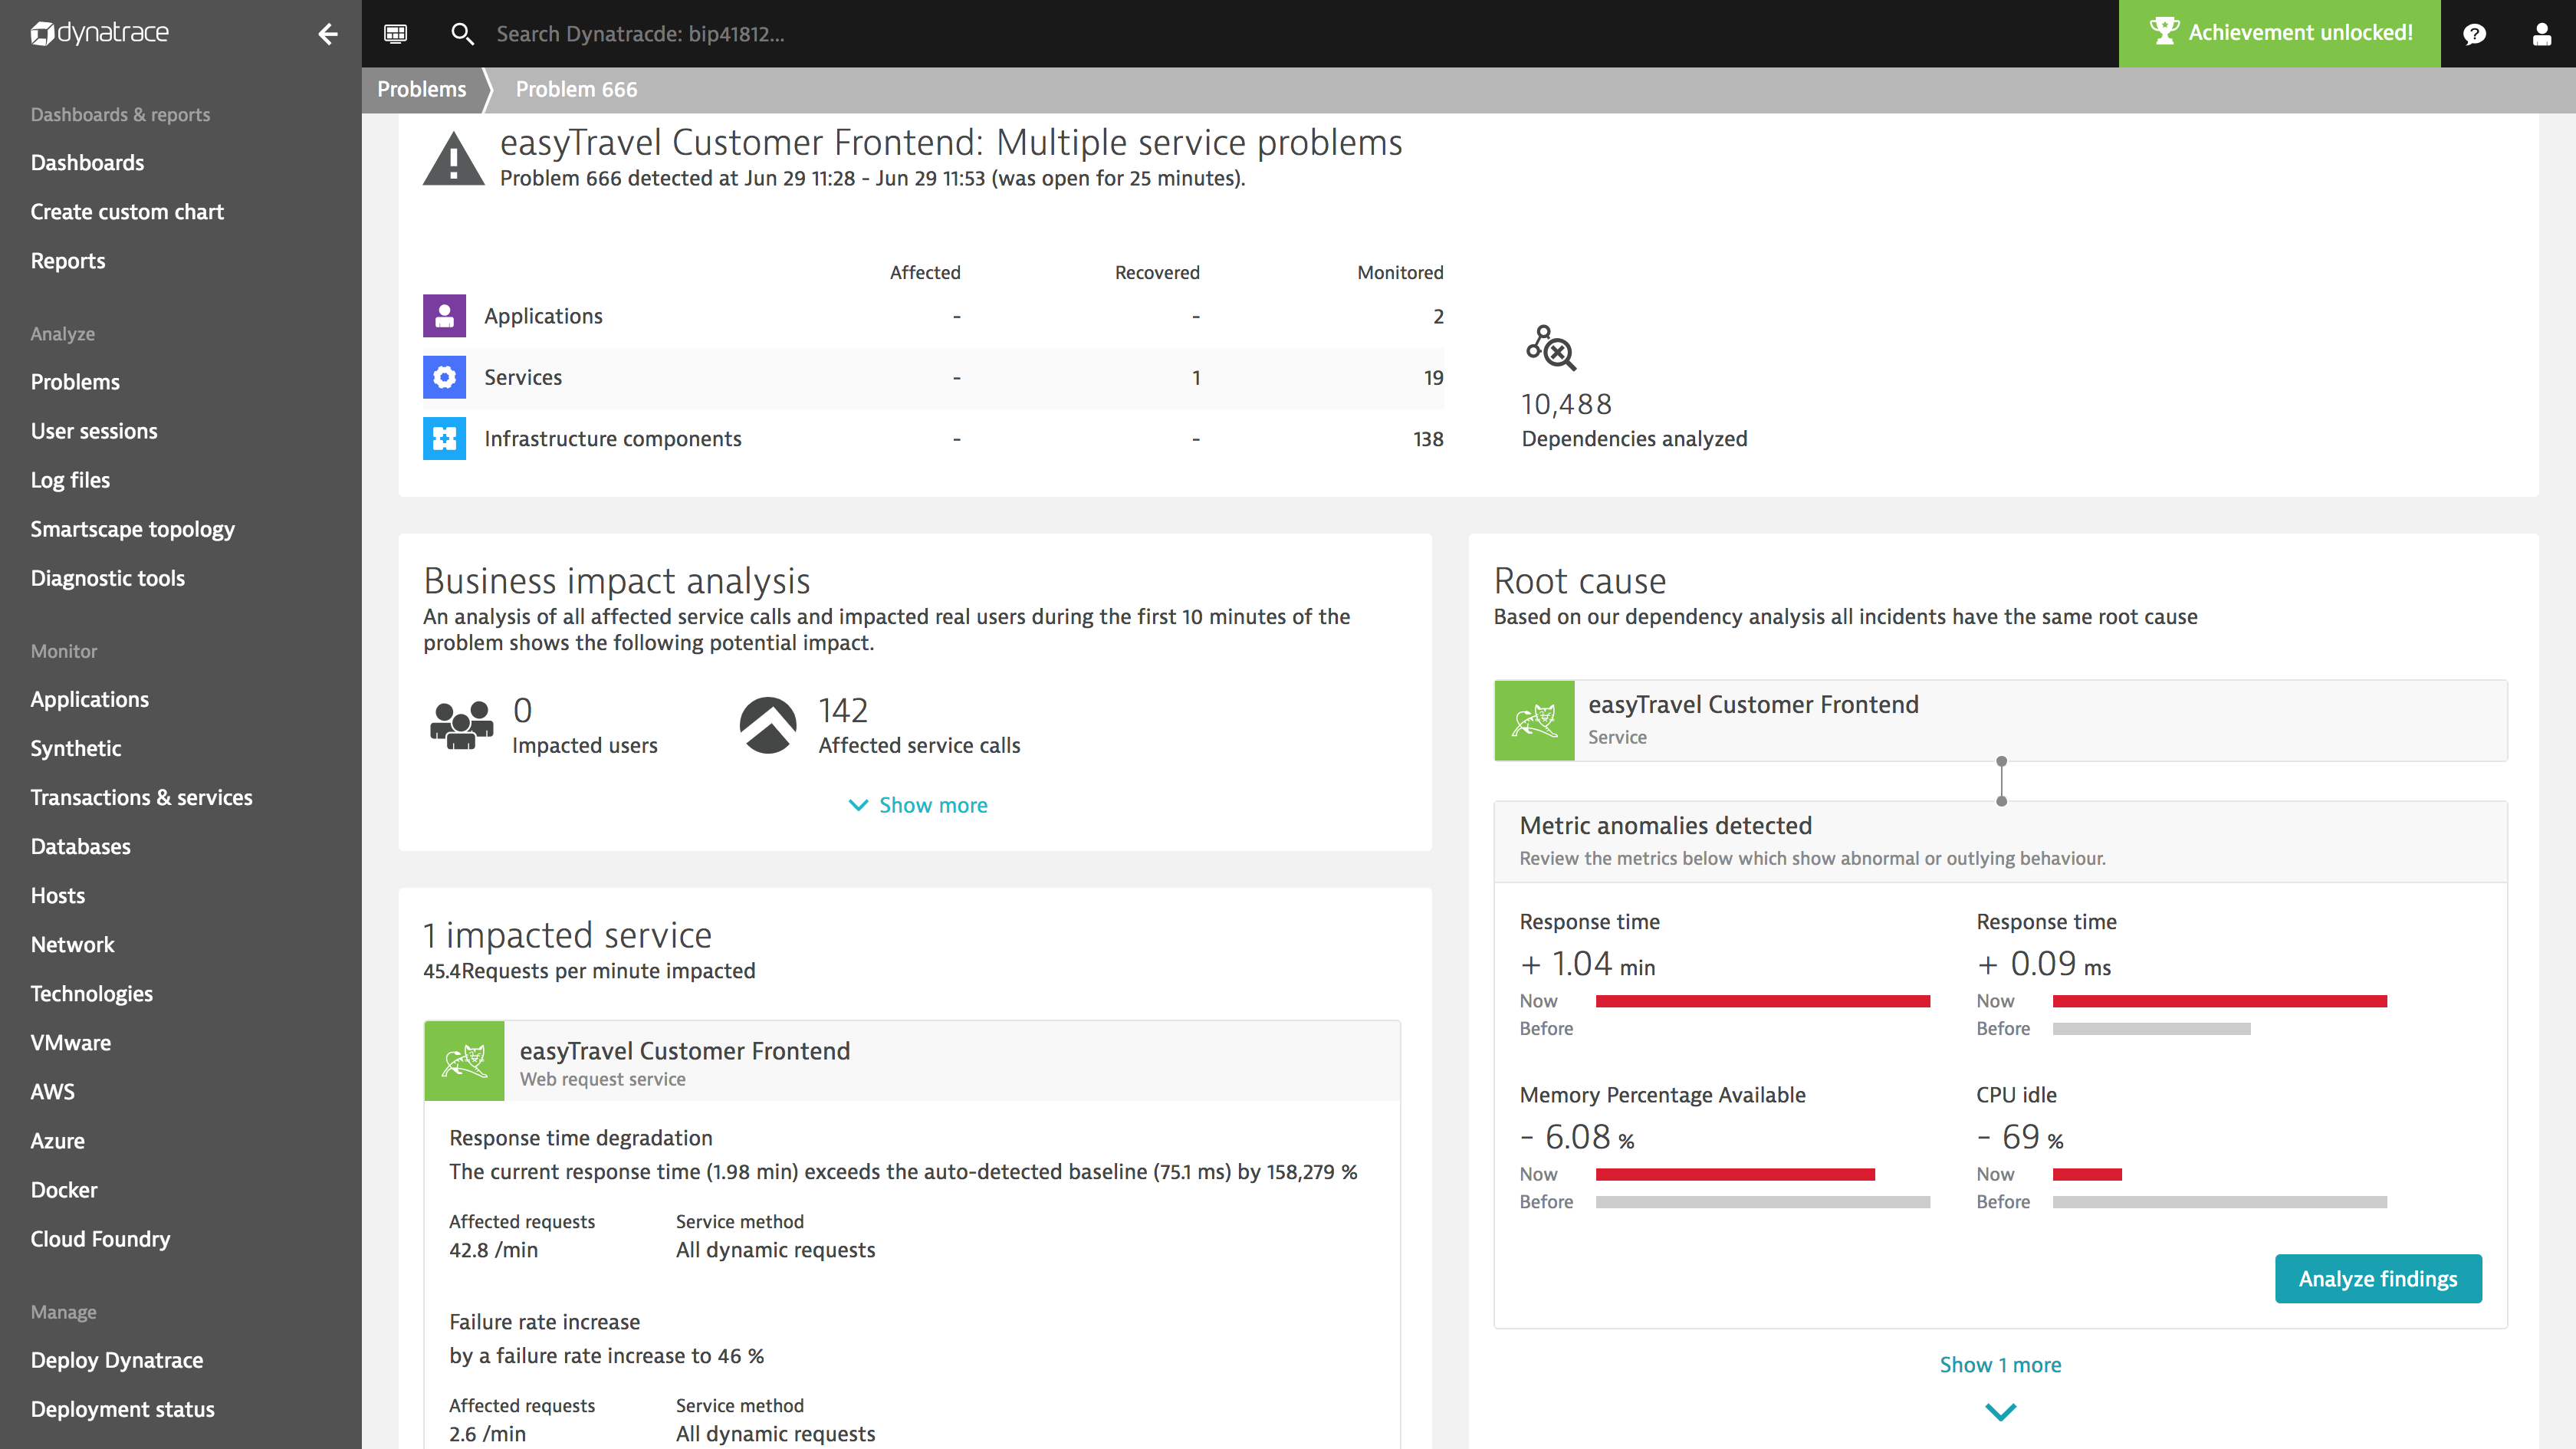
Even though the platform managed to run multiple instances of the frontend service, user experience of the application front end was quite poor.
Nail down problems in your application
The increase in response time in this example can be attributed to high suspension time of the JVM running the frontend. Suspension time is the amount of time that requests are suspended by the JVM for purposes of garbage collection. In the example below, you can see that the JVM was stuck in garbage collection, which caused the requests to time out.
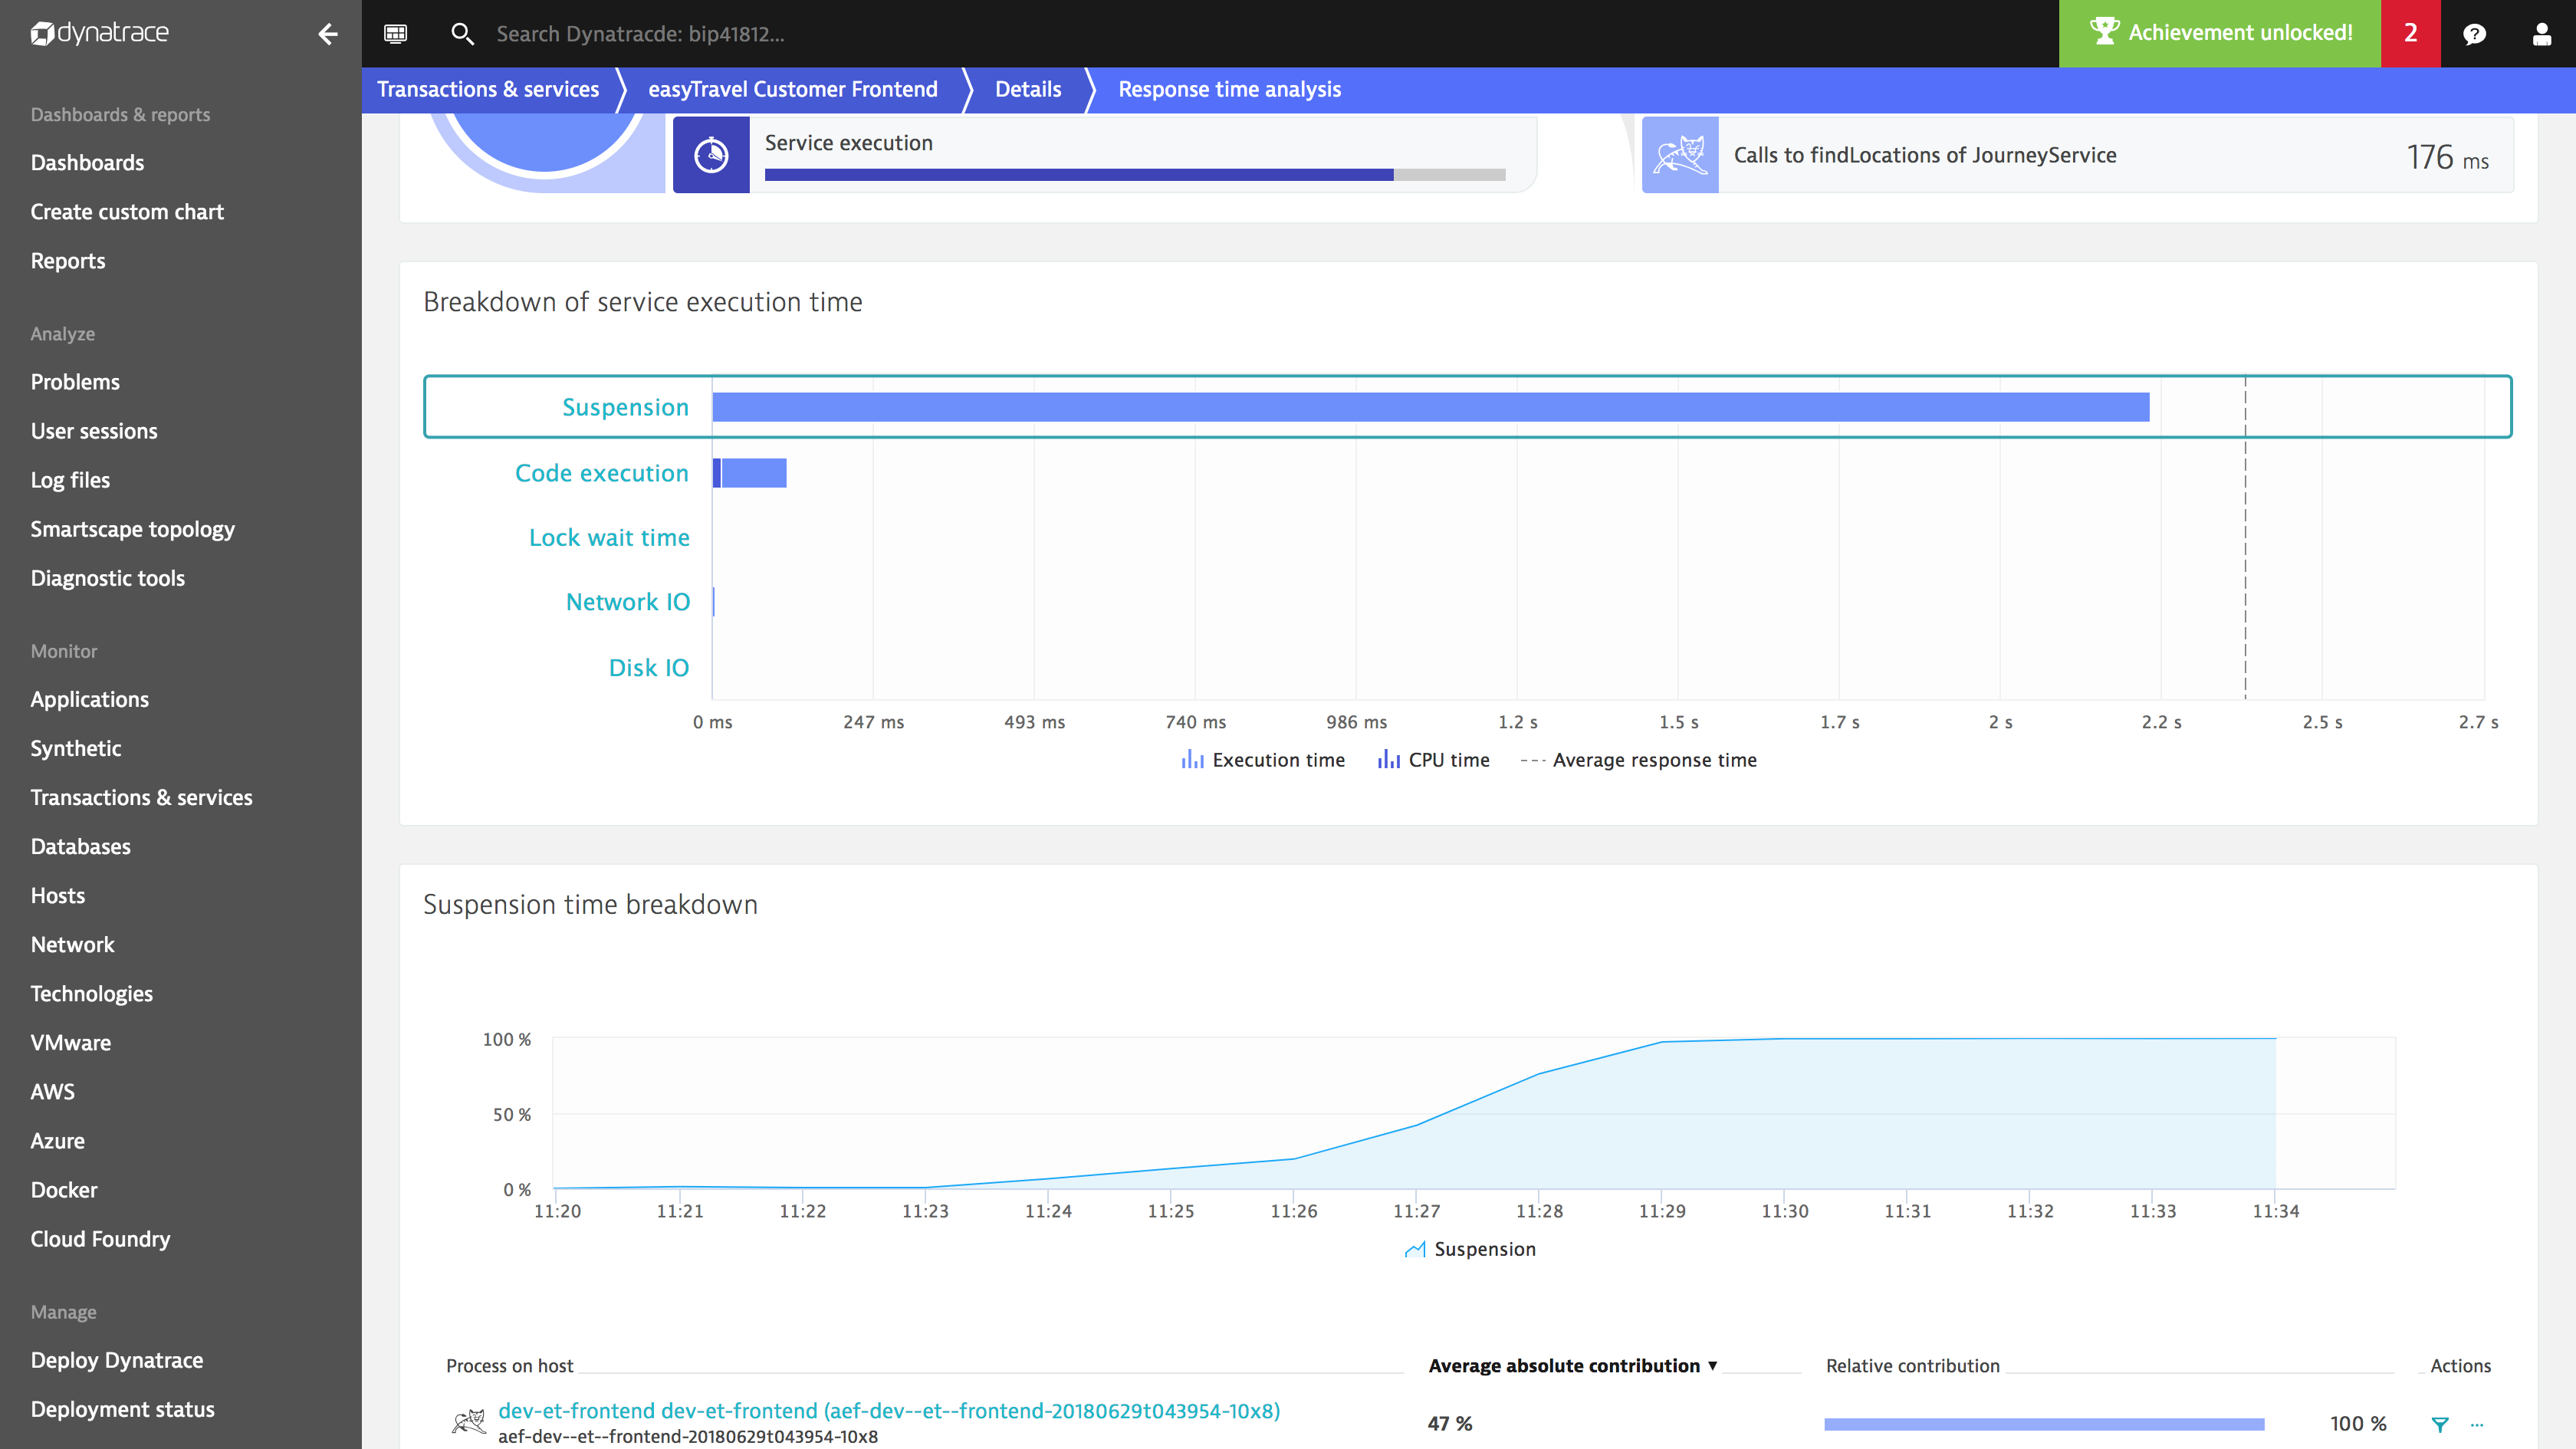
High suspension time is a clear indicator of a problem with the memory settings for the JVM. Dynatrace also detected some thrown OutOfMemoryErrors for one of the JVMs serving the frontend in GAE.
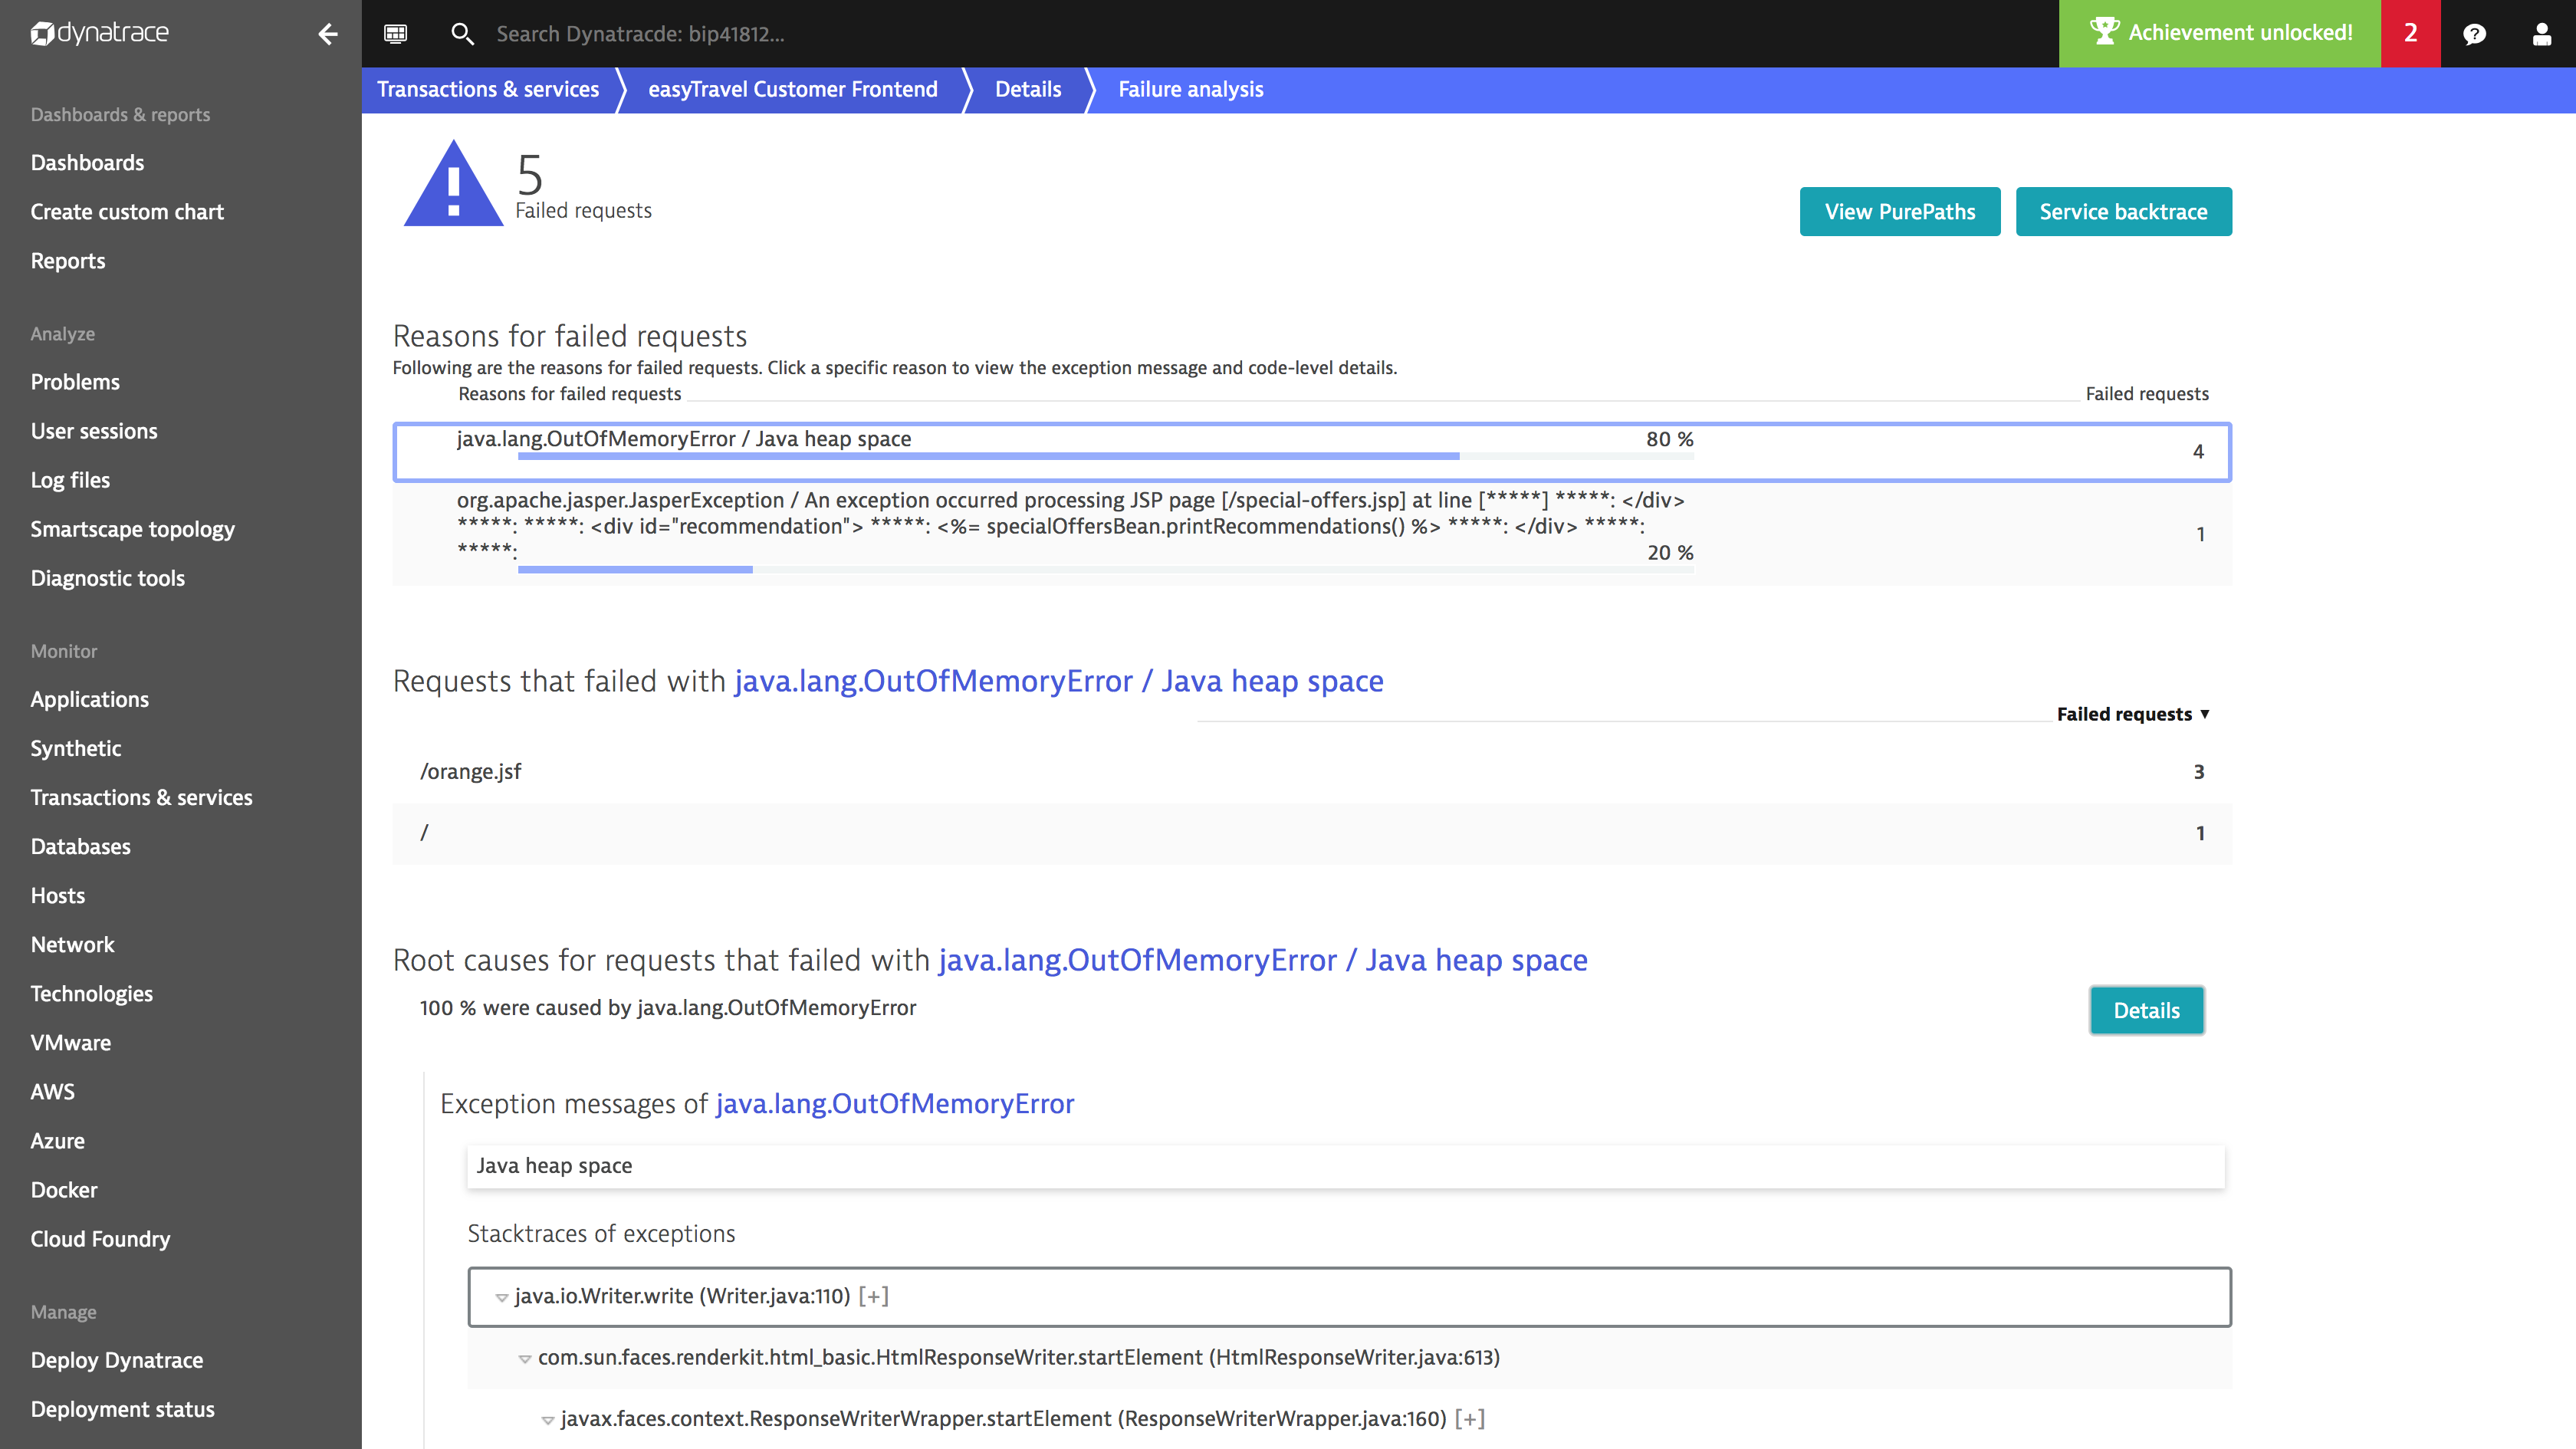
The application’s container runs with a memory limit of 820MB which isn’t enough for the app. Increasing the memory limit in the application’s
app.yaml deployment configuration would help here.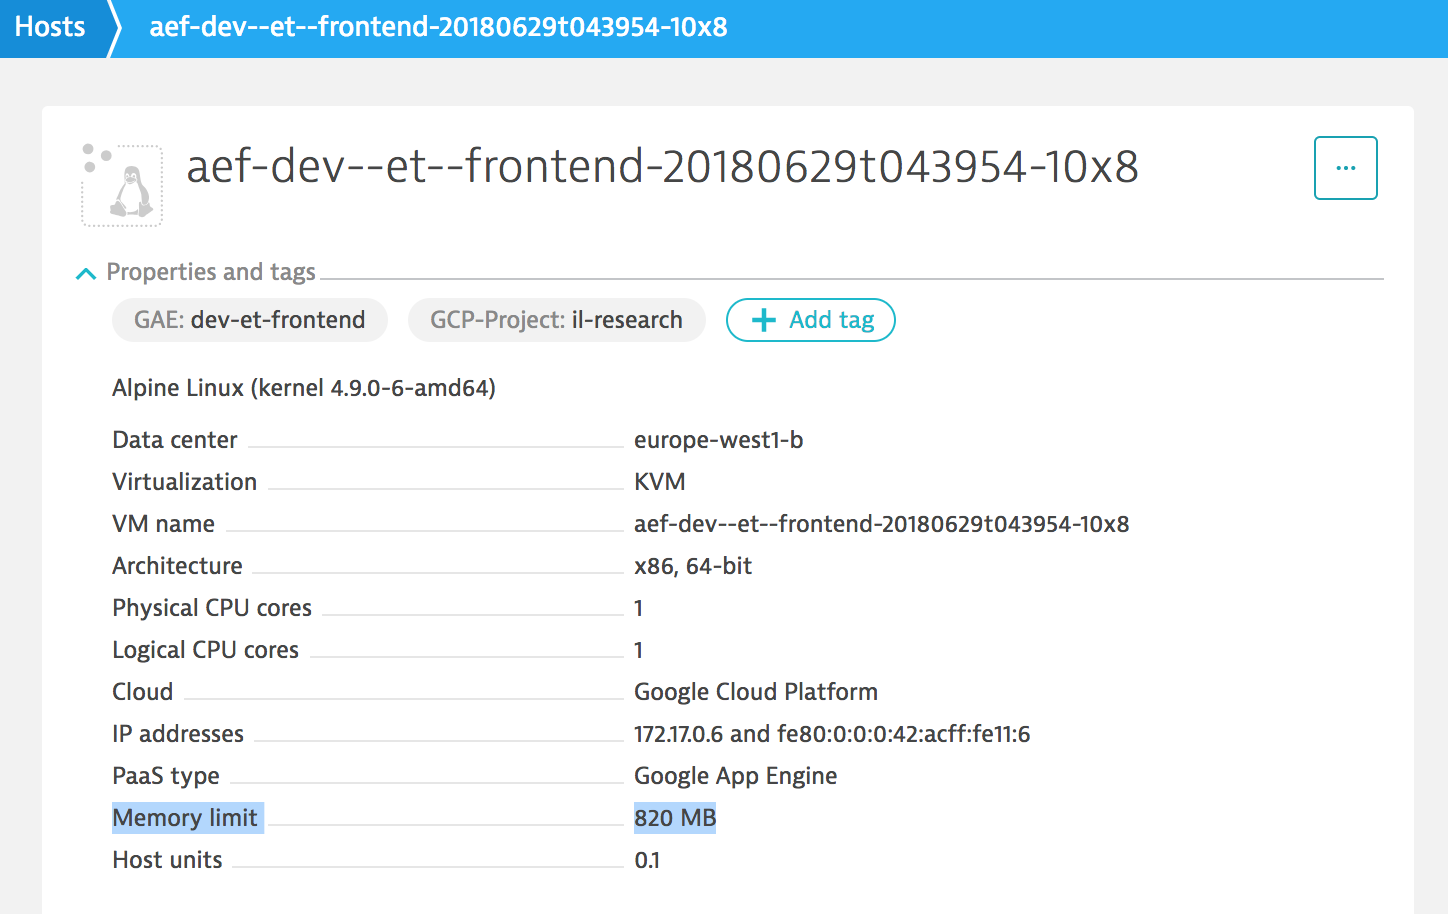
How to get started
Dynatrace OneAgent v1.147 (and above) support the monitoring of applications running in Google App Engine flexible environment. The guidelines available in our documentation enable you to monitor your application workloads on Google App Engine.
What’s next?
In the coming weeks, we’ll announce many new enhancements related to Google Cloud Platform, including full support of Container Optimized OS-based GKE clusters, and extended Google Compute Engine support in Dynatrace. So stay tuned, there’s much more to come!


Looking for answers?
Start a new discussion or ask for help in our Q&A forum.
Go to forum