
Have a unique technology or custom application that Dynatrace doesn’t monitor out-of-the-box? No problem! We’re proud to announce the beta release of custom monitoring plugins for Dynatrace. Now you can build your own plugins to serve your unique monitoring needs.
With custom monitoring plugins you can:
- Create and deploy new plugins that support your organization’s unique monitoring needs.
- Enjoy total flexibility, decide what you need and how the results will be displayed.
- Use the power of Dynatrace AI—your custom alerts are correlated and included in root cause analysis.
- Use our Python SDK, which is equipped with advanced troubleshooting capabilities.
- Take advantage of custom metrics for processes. Custom metrics are displayed alongside the standard set of OneAgent performance metrics.
Build your custom plugin
Custom plugins can be created for any process that exposes an interface, such as processes that are served over HTTP (for example, databases, applications, and load balancers). To begin, you need to create some Python code and write a JSON file that describes your metrics and how you want to display them. For complete instructions and examples, see How to write your first OneAgent plugin.
To download the Dynatrace SDK
- Go to Settings > Monitoring > Monitored technologies > Custom plugins – beta tab.
- Click the Download SDK button.
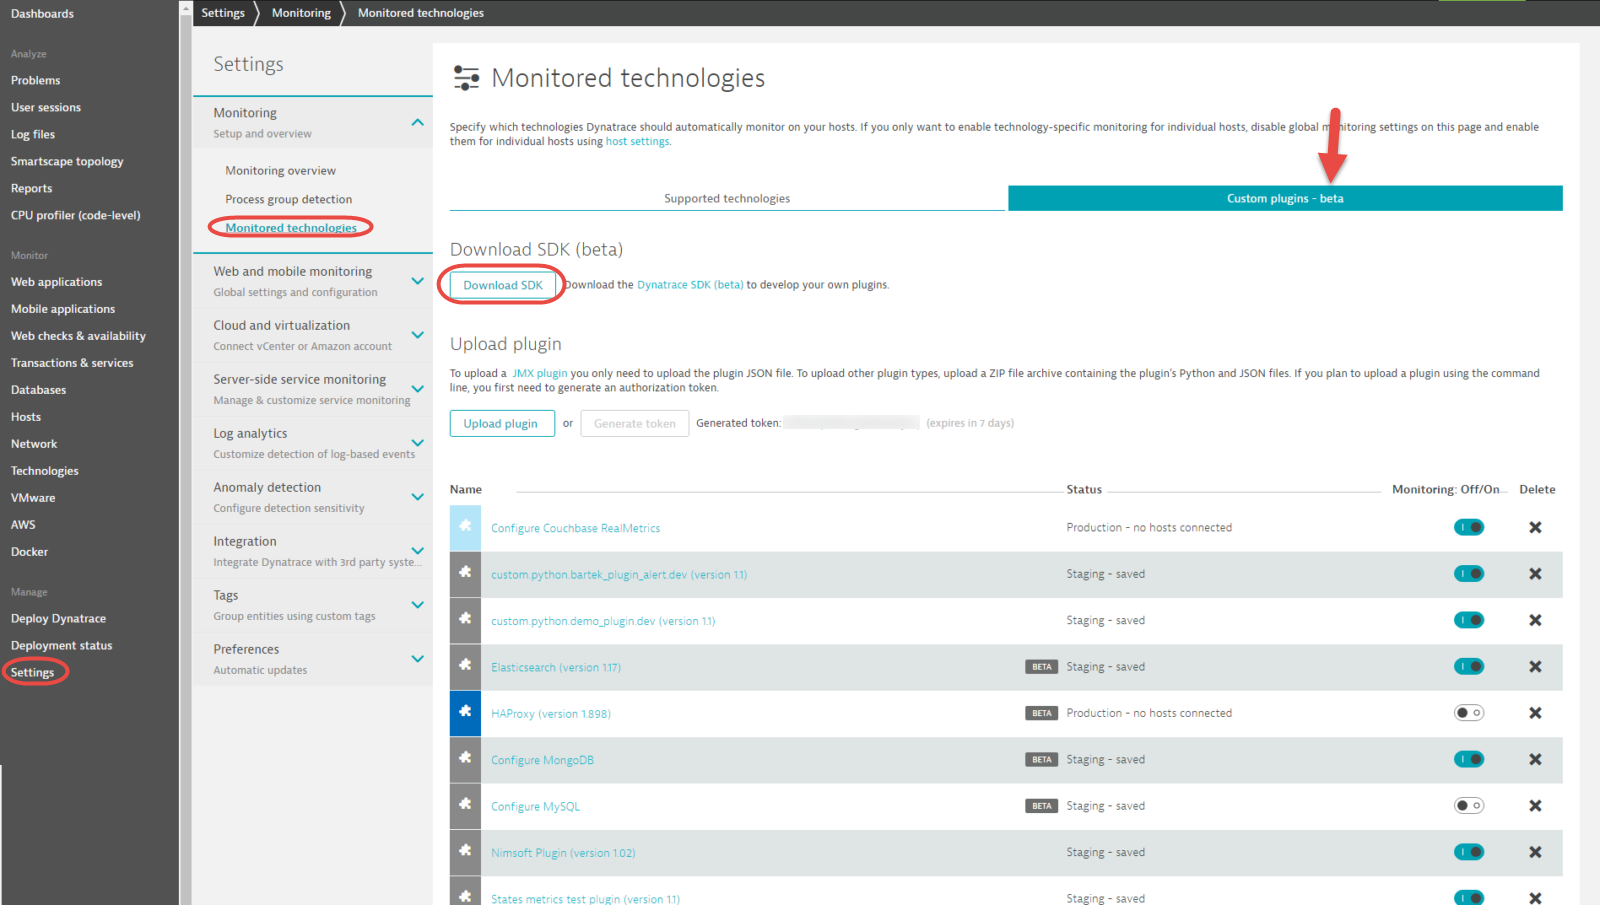
Upload your custom plugin
Once you’ve downloaded the Dynatrace SDK (see above) and built your new plugin (as explained in How to write your first OneAgent plugin) it’s time to upload your plugin to your Dynatrace environment.
- Go to Settings > Monitoring > Monitored technologies > Custom plugins – beta tab.
- Click the Upload plugin button.
- Select the ZIP file archive that contains your plugin’s Python and JSON files.
- Once successfully uploaded, your plugin will appear in the list on the Custom plugins – beta tab.
Note: Alternatively, the OneAgent upload plugin commandline tool can be used to perform the upload.
Note: If you make changes to your plugin in the future, remember to upload the updated plugin’s ZIP archive to Dynatrace.
View custom plugin metrics
To verify that your new custom plugin works, navigate to your application’s Host page and click the process you’re working on (see example Python process below).
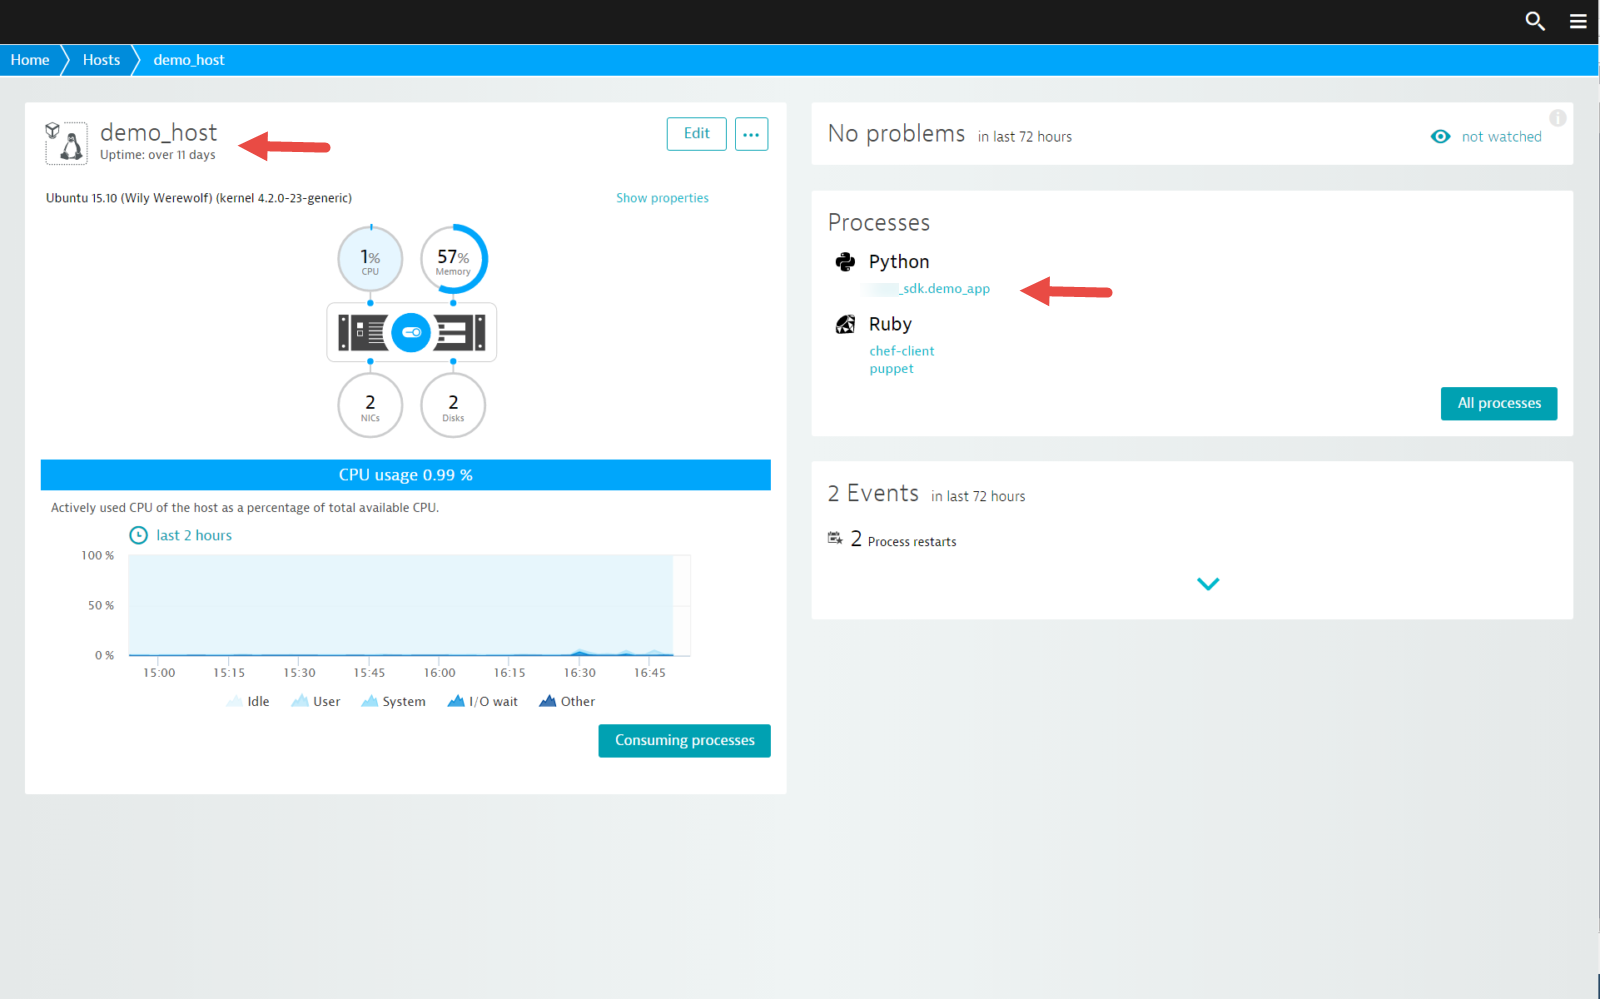
Your custom metrics will appear on the Further details tab (see Uncategorized metrics example below).
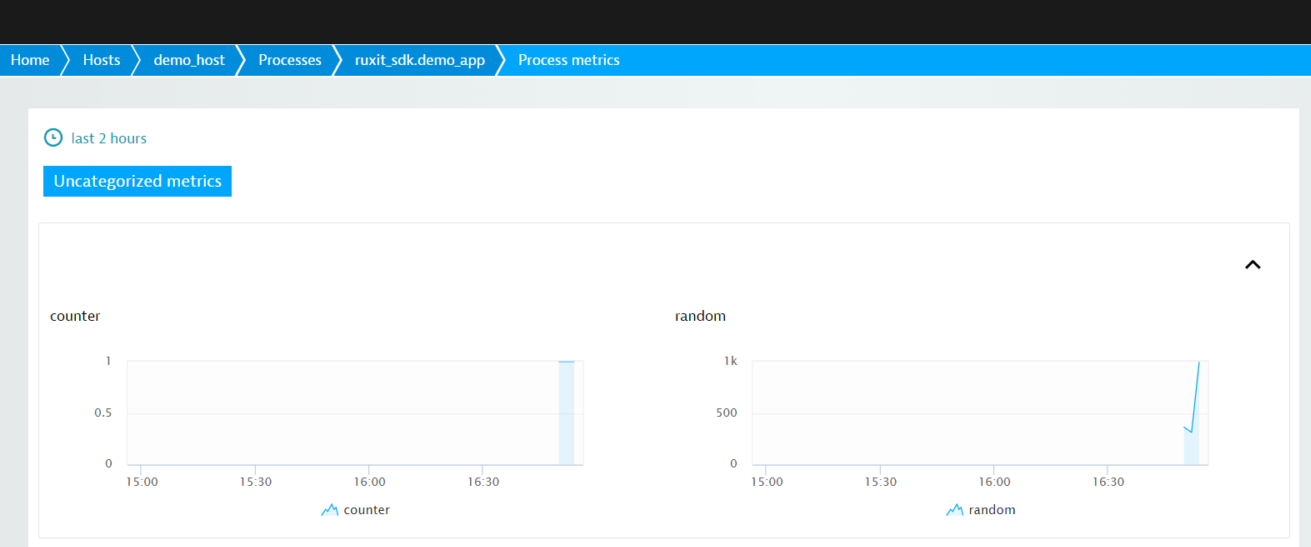
Visual display of custom metrics
There are many more options for visual display of custom metrics include the following:
- Presentation of metric data on either the associated Process details page or the process’ Further details tab.
- Grouping charts with tabs.
- Presentation of chart dimensions beneath each chart.
- Chart titles, descriptions, and more.
Ready to get started writing your own plugin? Have a look at useful plugin examples delivered with OneAgent Extensions SDK to get started.


Looking for answers?
Start a new discussion or ask for help in our Q&A forum.
Go to forum