
It’s been about a year since we first introduced the Time frame selector feature in Dynatrace (available in the menu bar of most Dynatrace pages). The Time frame selector enables you to select a specific analysis time frame that remains persistent across all product pages and views as you navigate through your analysis. This is an extremely helpful feature for analyzing issues that affect multiple aspects of your environment. Thanks to the invaluable feedback that we’ve received from our customers, we’ve redesigned the Time frame selector to make it more useful than ever.
Easily accessible time frame navigation
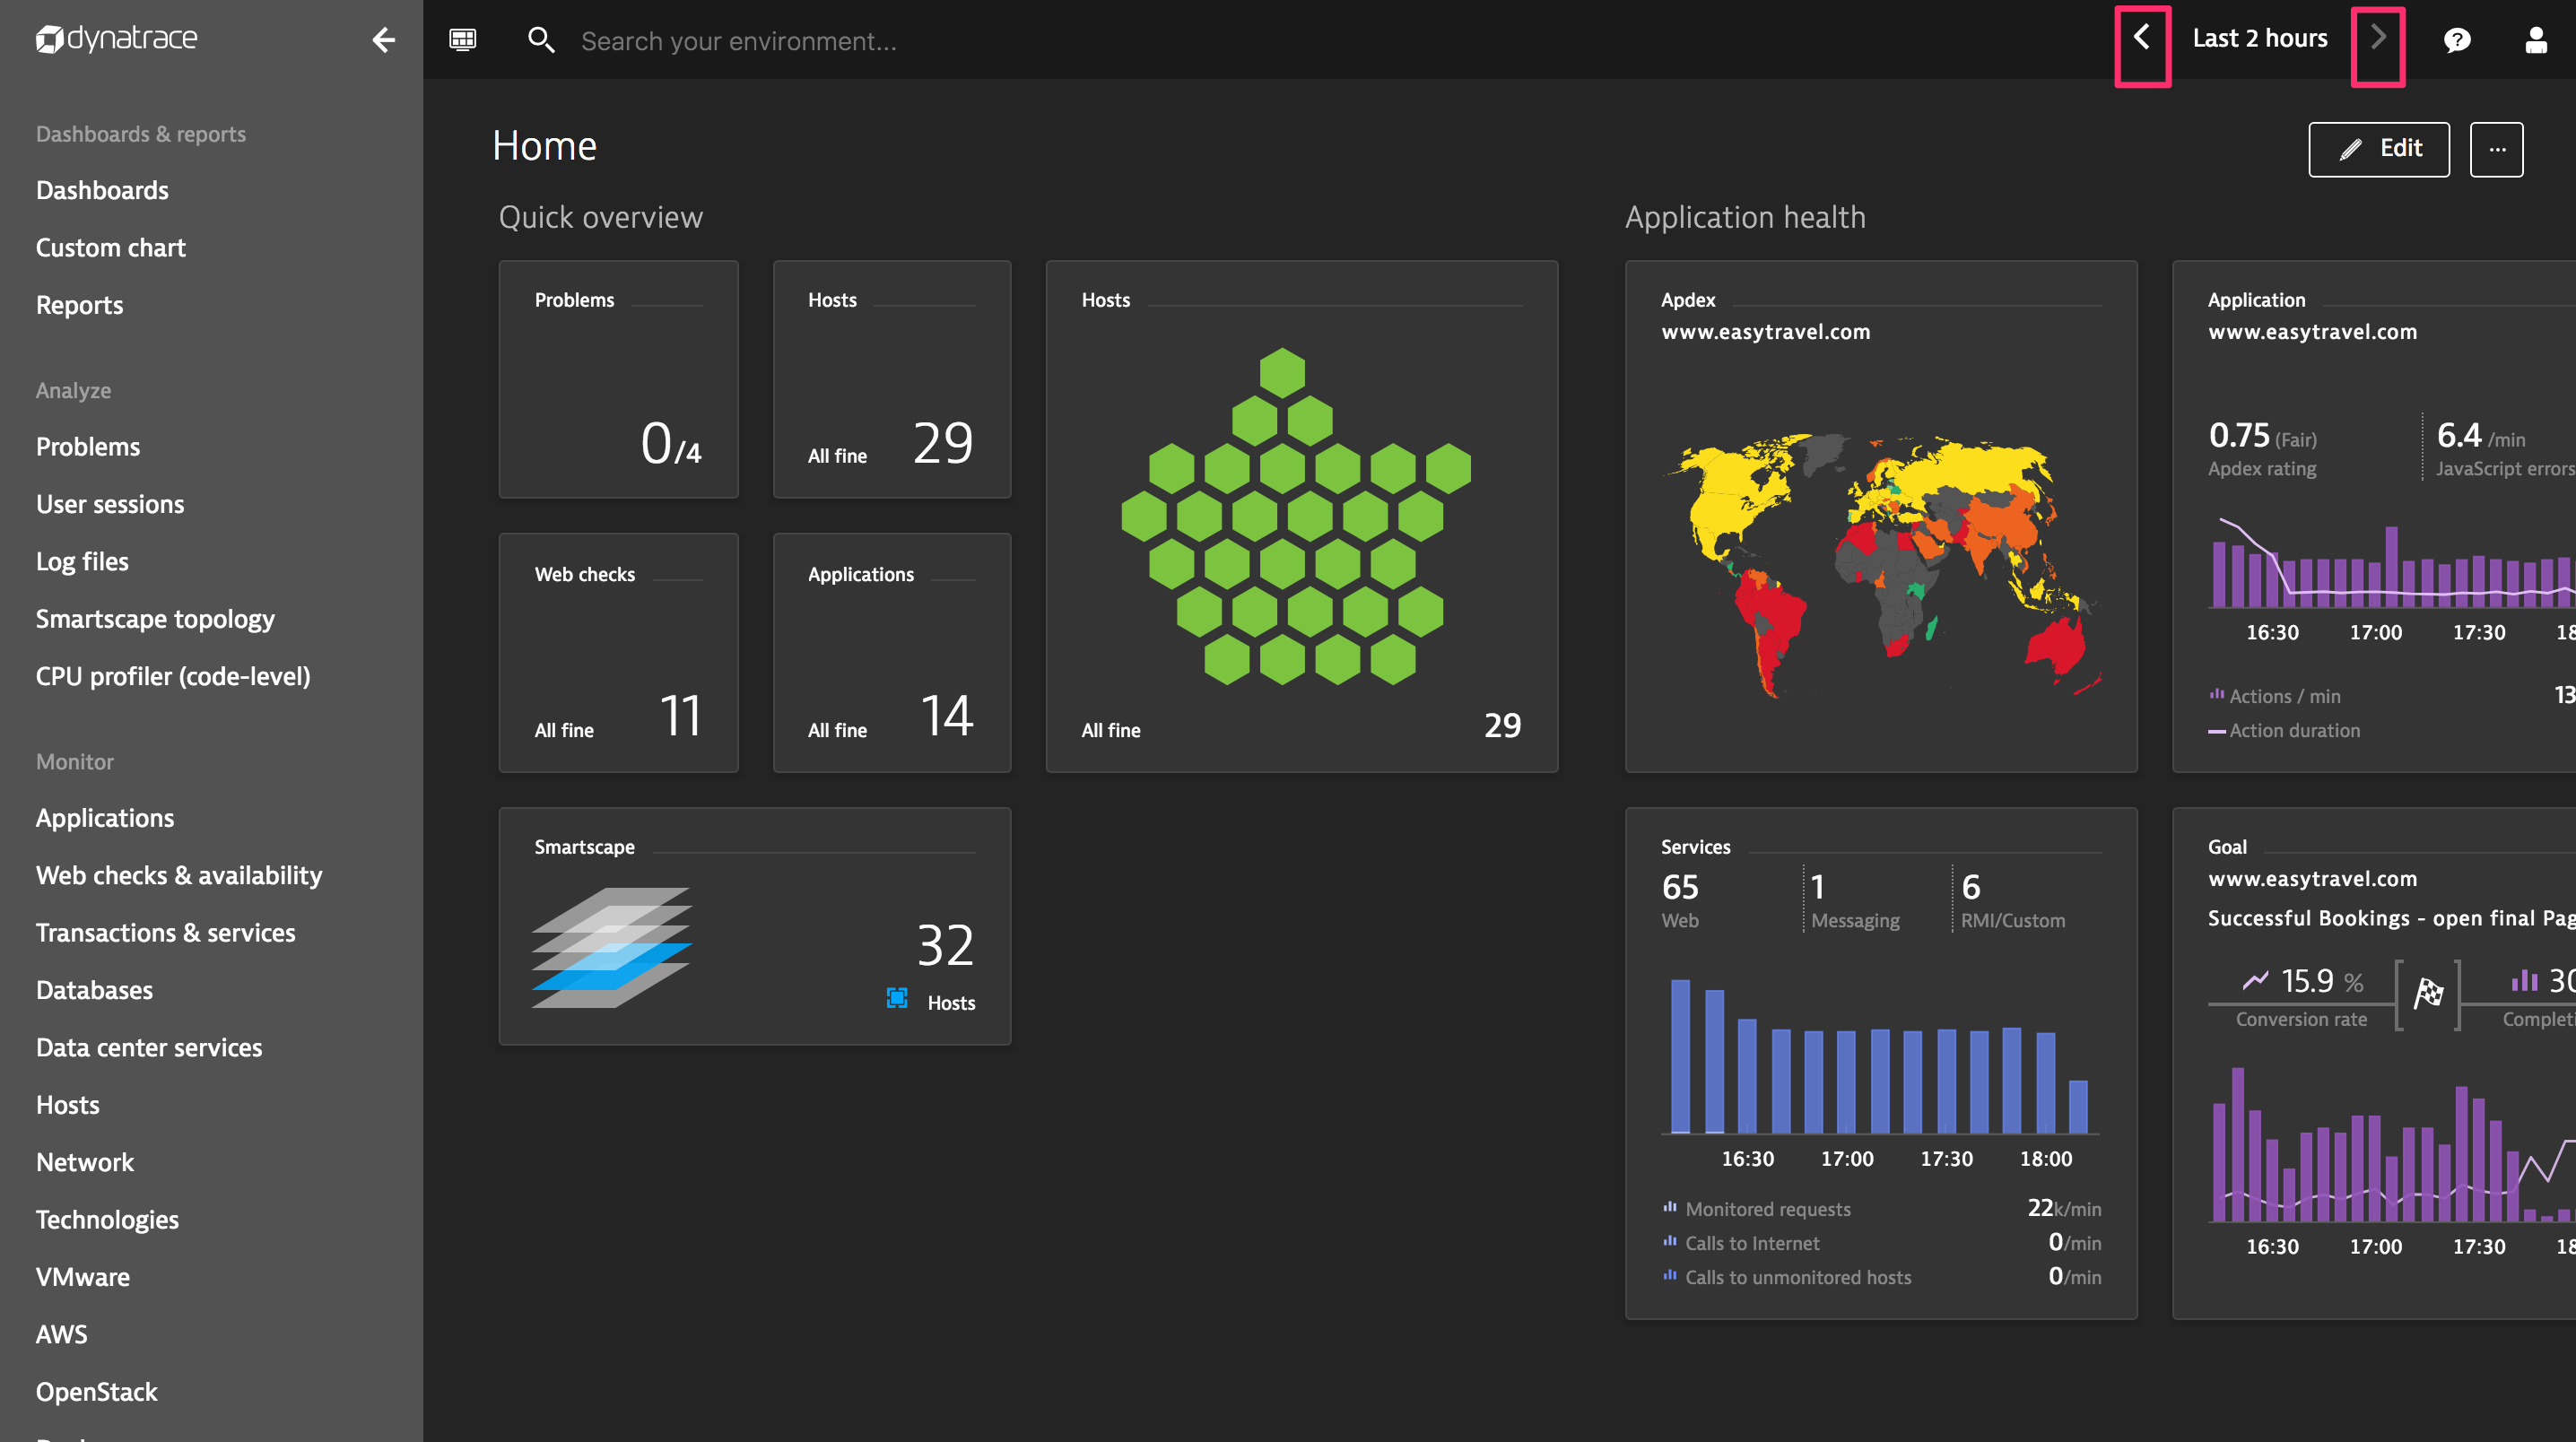
One of the major changes that we’ve introduced is that the Next and Previous buttons are now available directly in the menu bar (see example below). This makes it easy to navigate incrementally forward or backward in time with only a single click.
Preset time frames
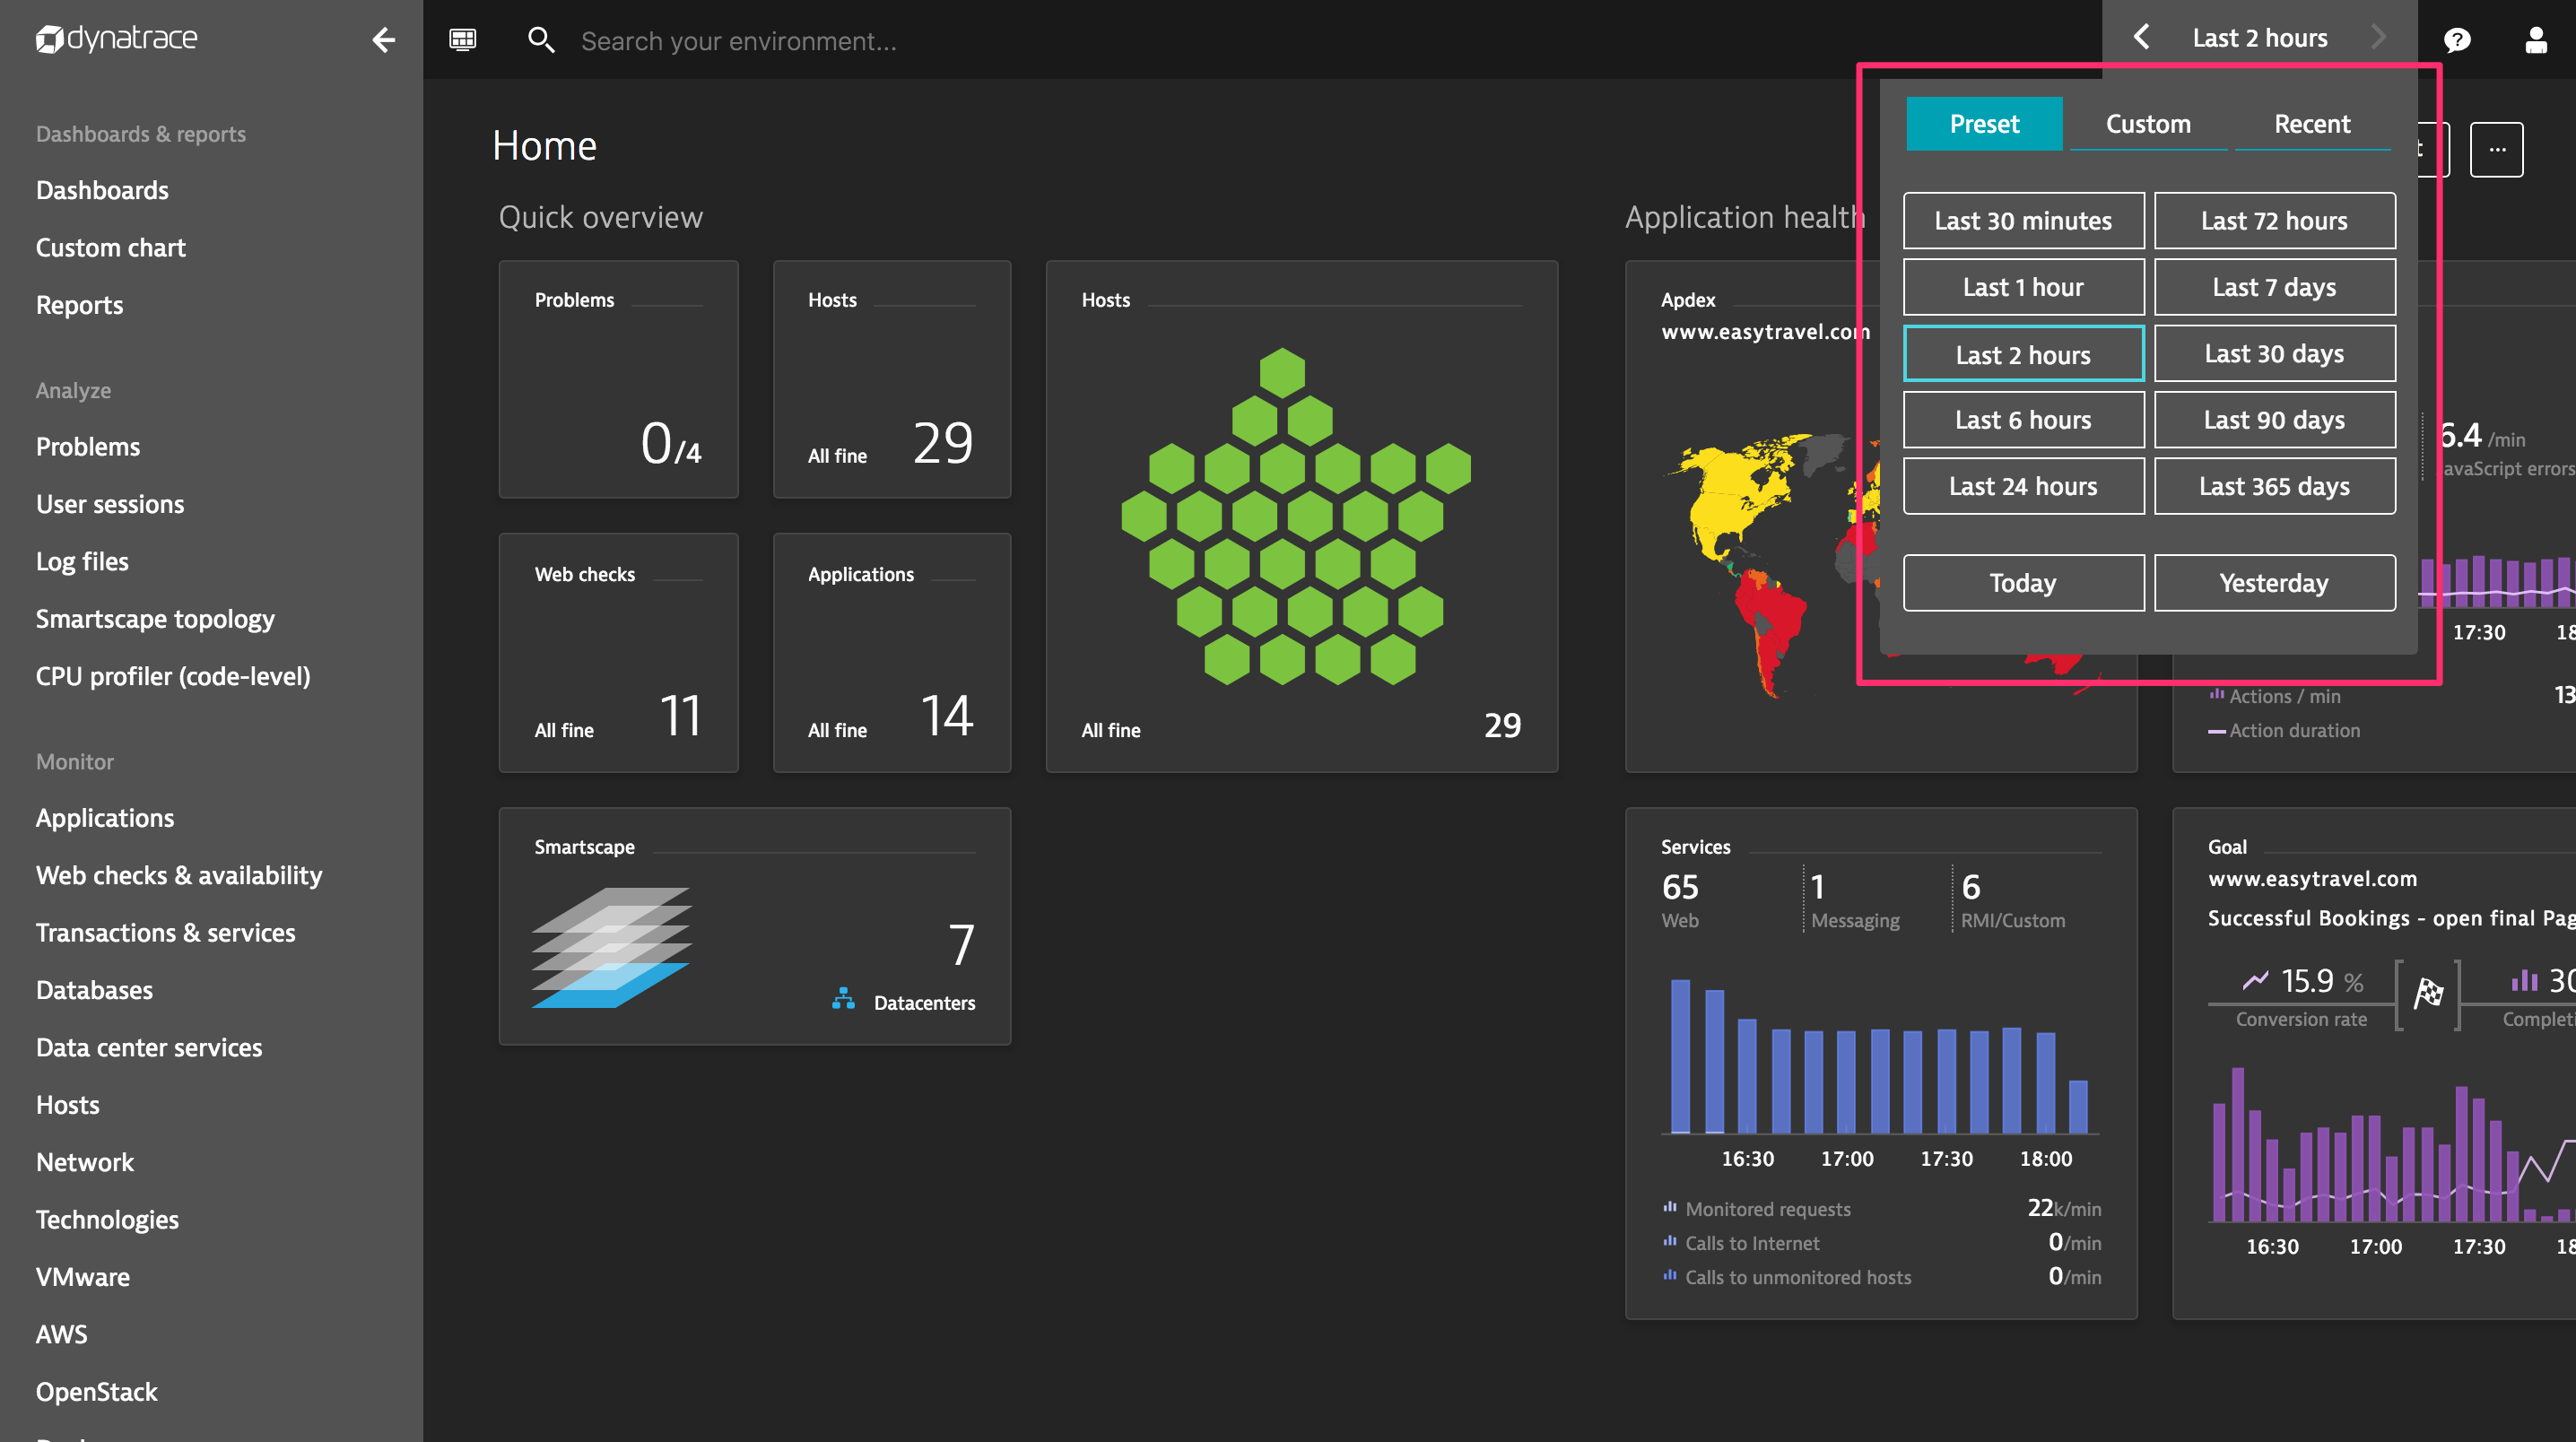
Another important change we’ve introduced are the Preset, Custom, and Recent tabs. The Preset tab enables you to quickly select a relative time frame (Last 30 minutes, Last 1 hour, Last 90 days, etc) or a fixed time frame (Today or Yesterday).
Custom time frames
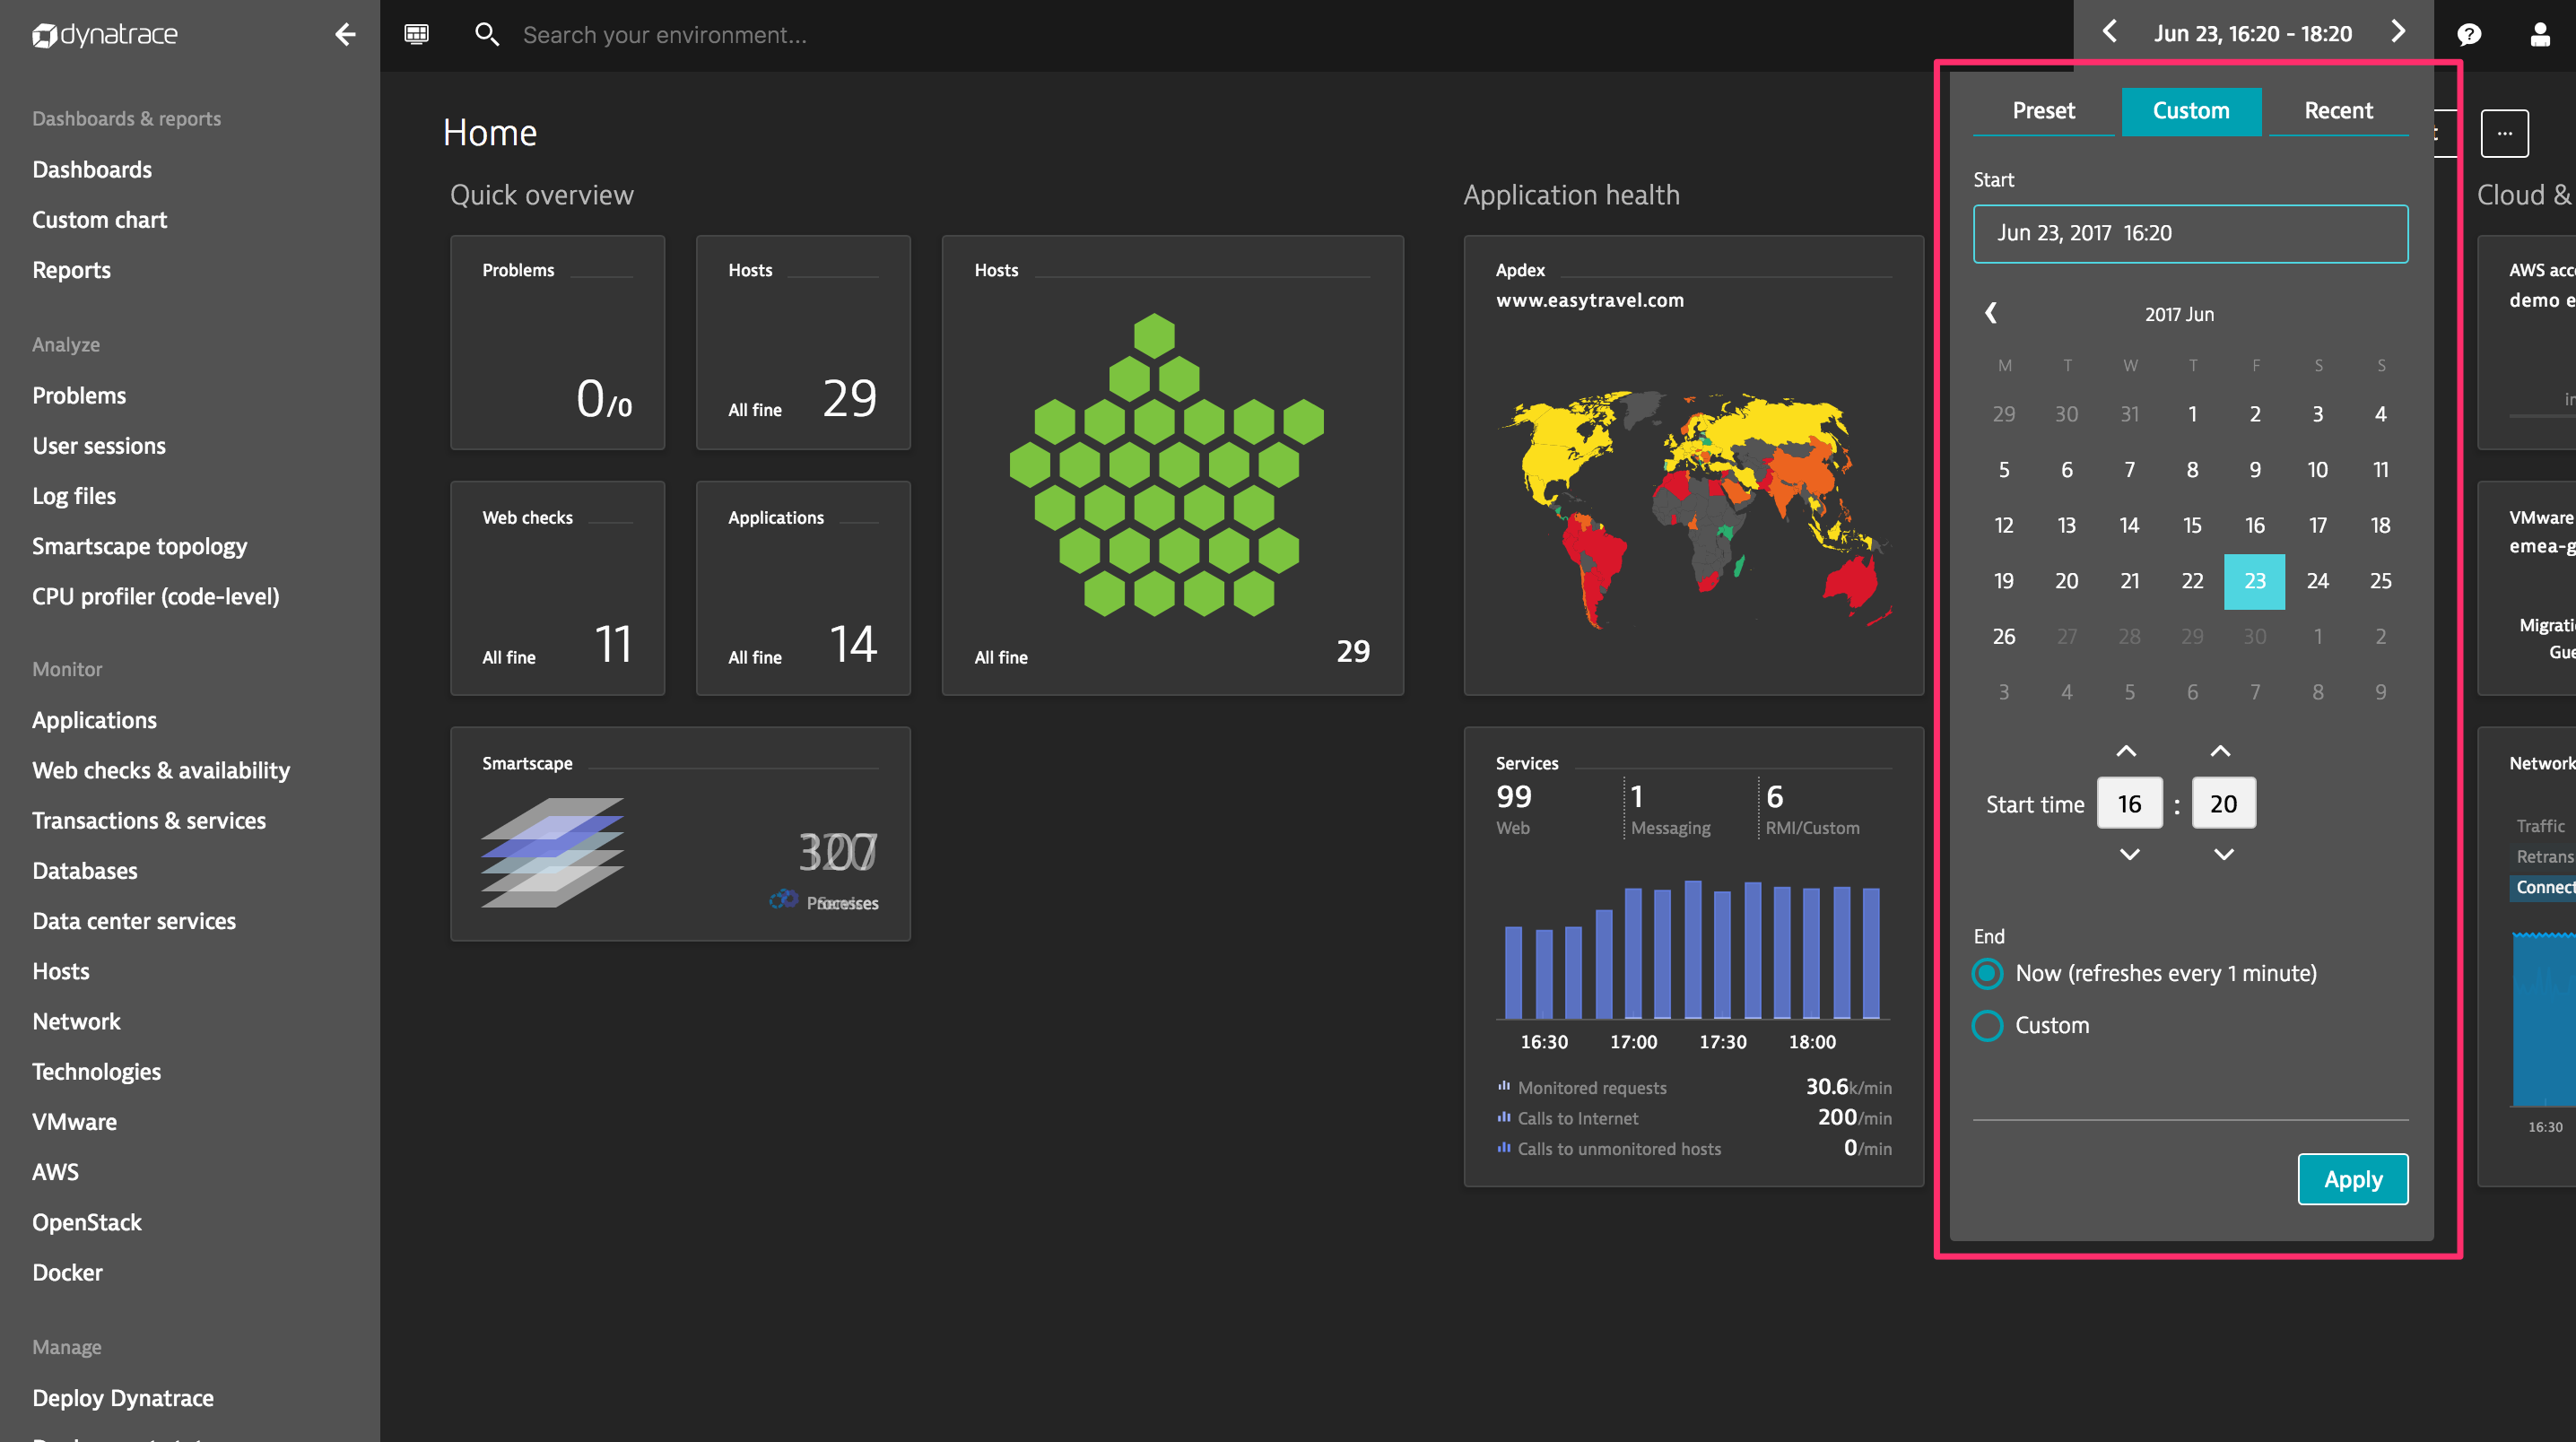
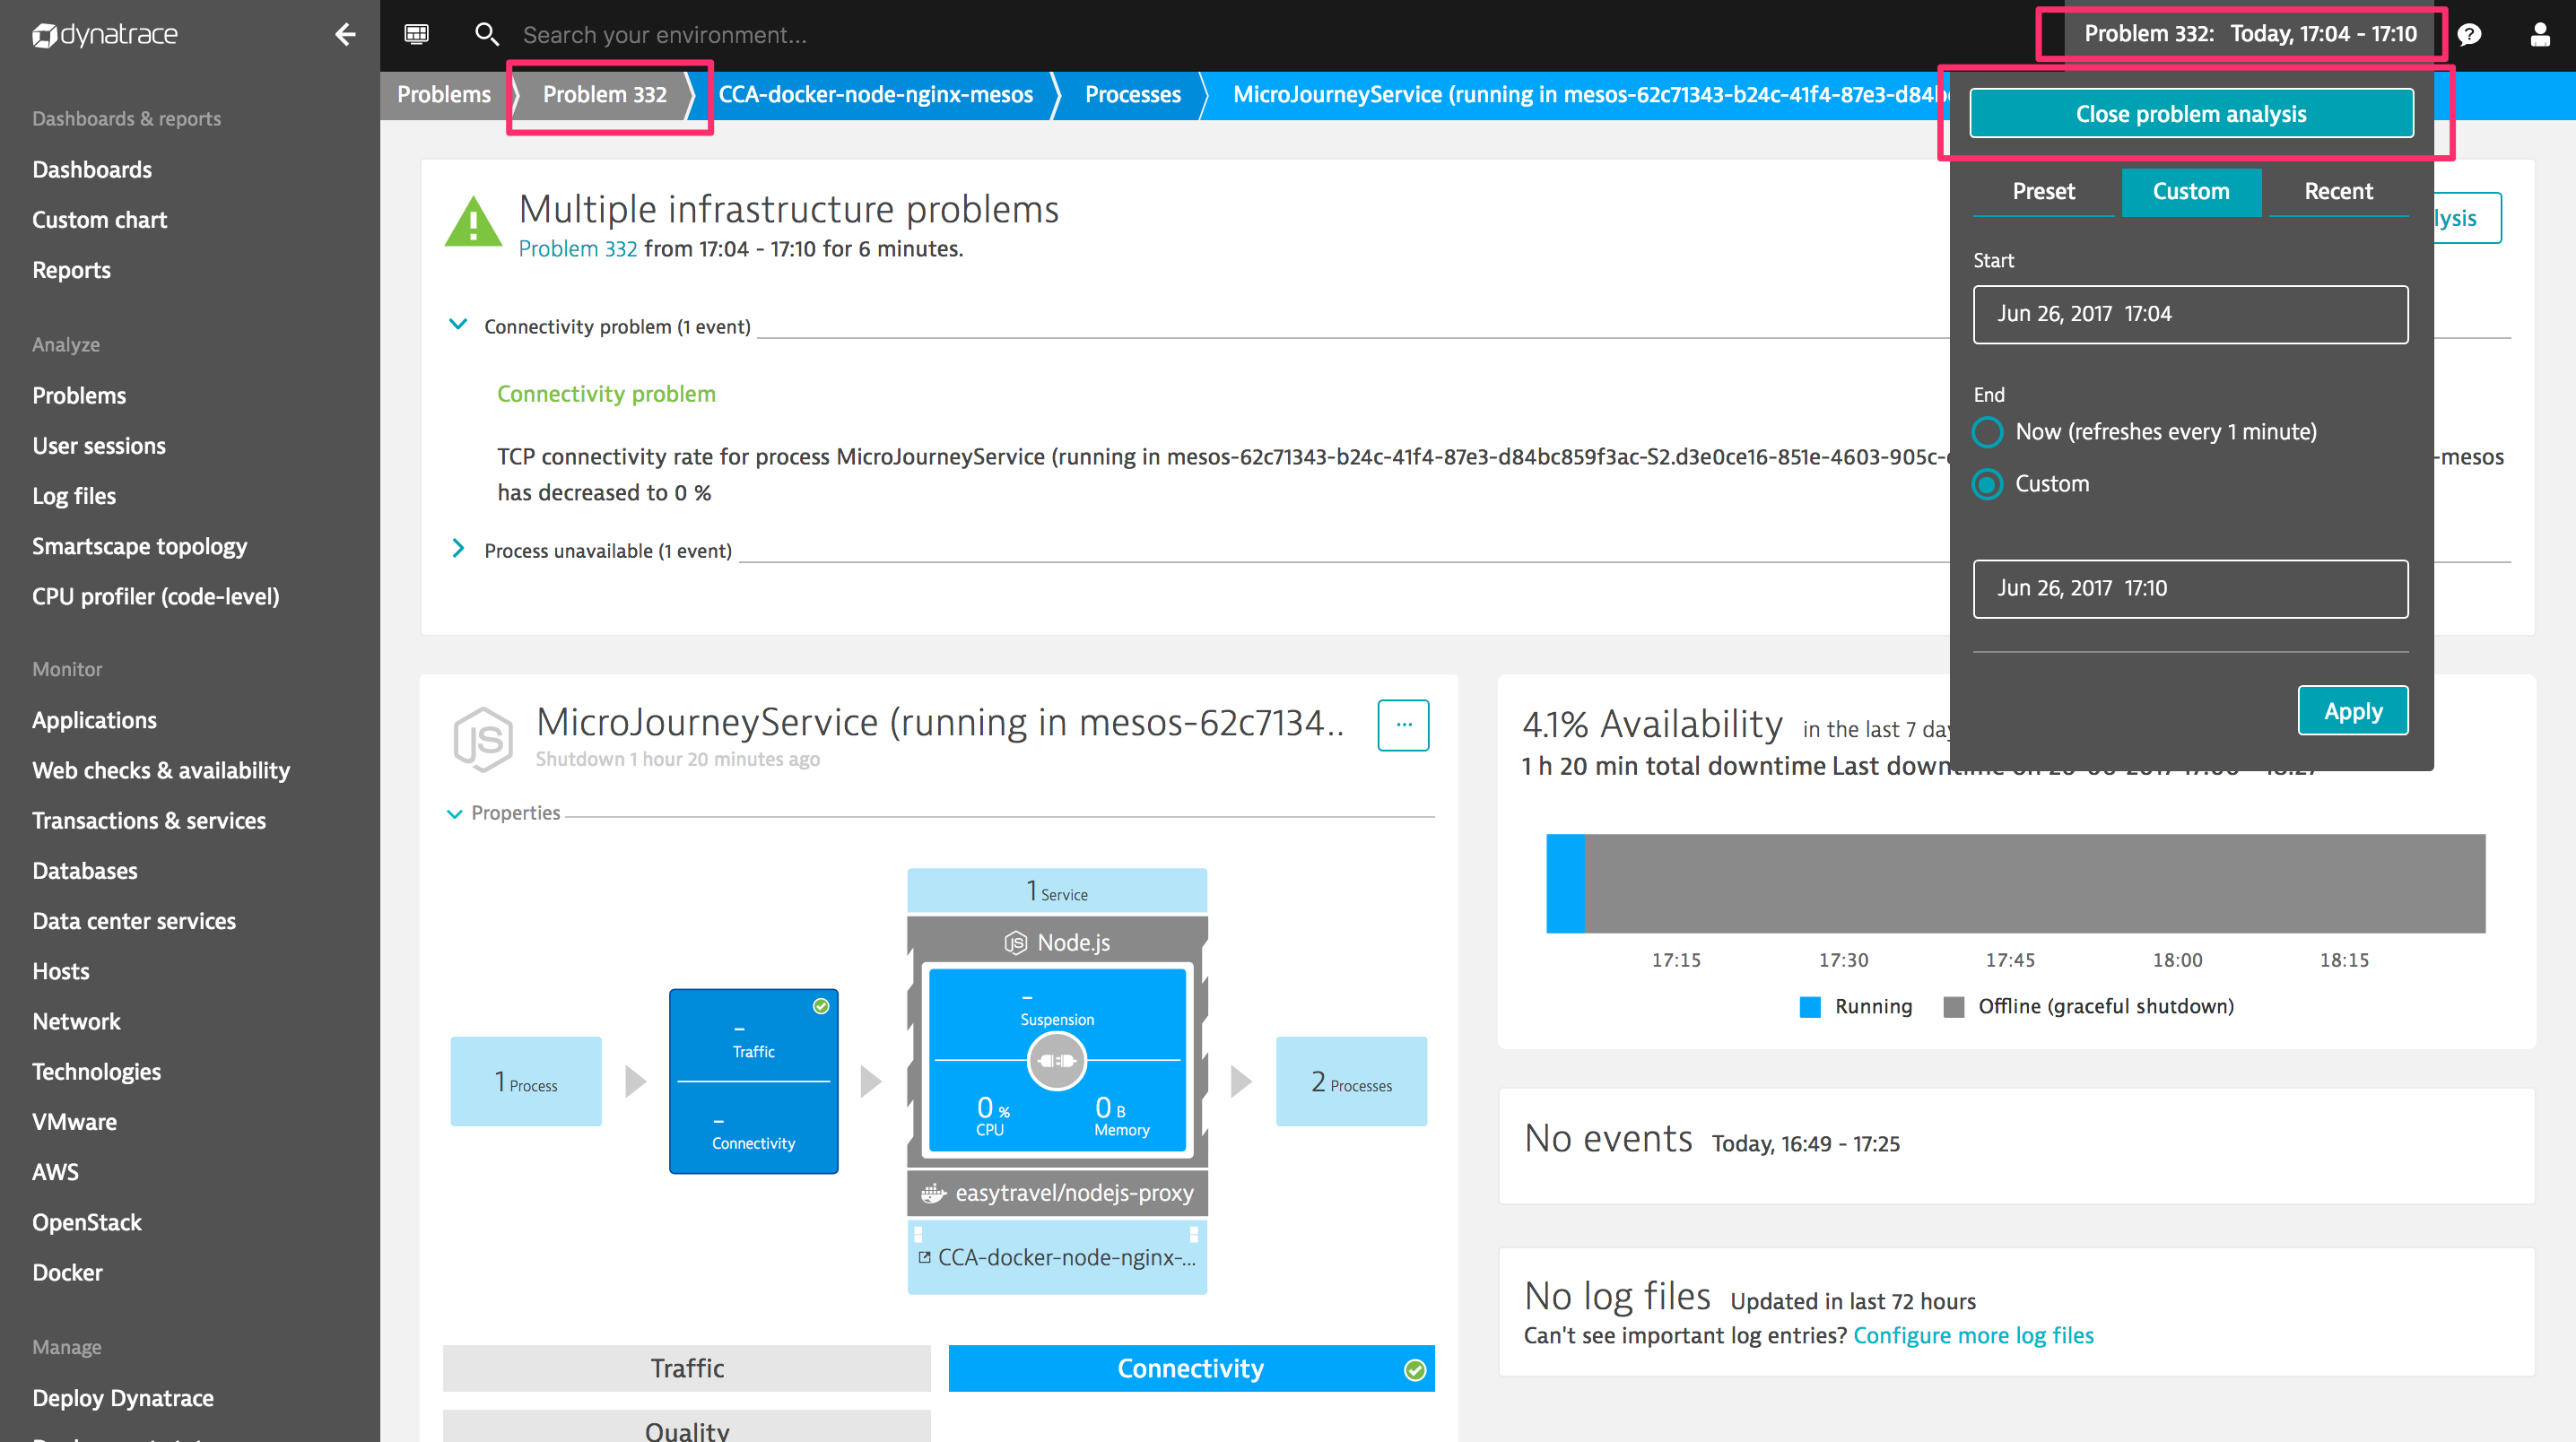
Setting custom time frames with specific dates and times is now easier than ever. Just select the Custom tab. A calendar feature and time picker are now integrated into the Time frame selector. Once you’ve defined the Start time of your custom time frame, either define a Custom end time or click the Now option button to set the end time at the present (the time frame will automatically refresh once per minute).
Recent time frames
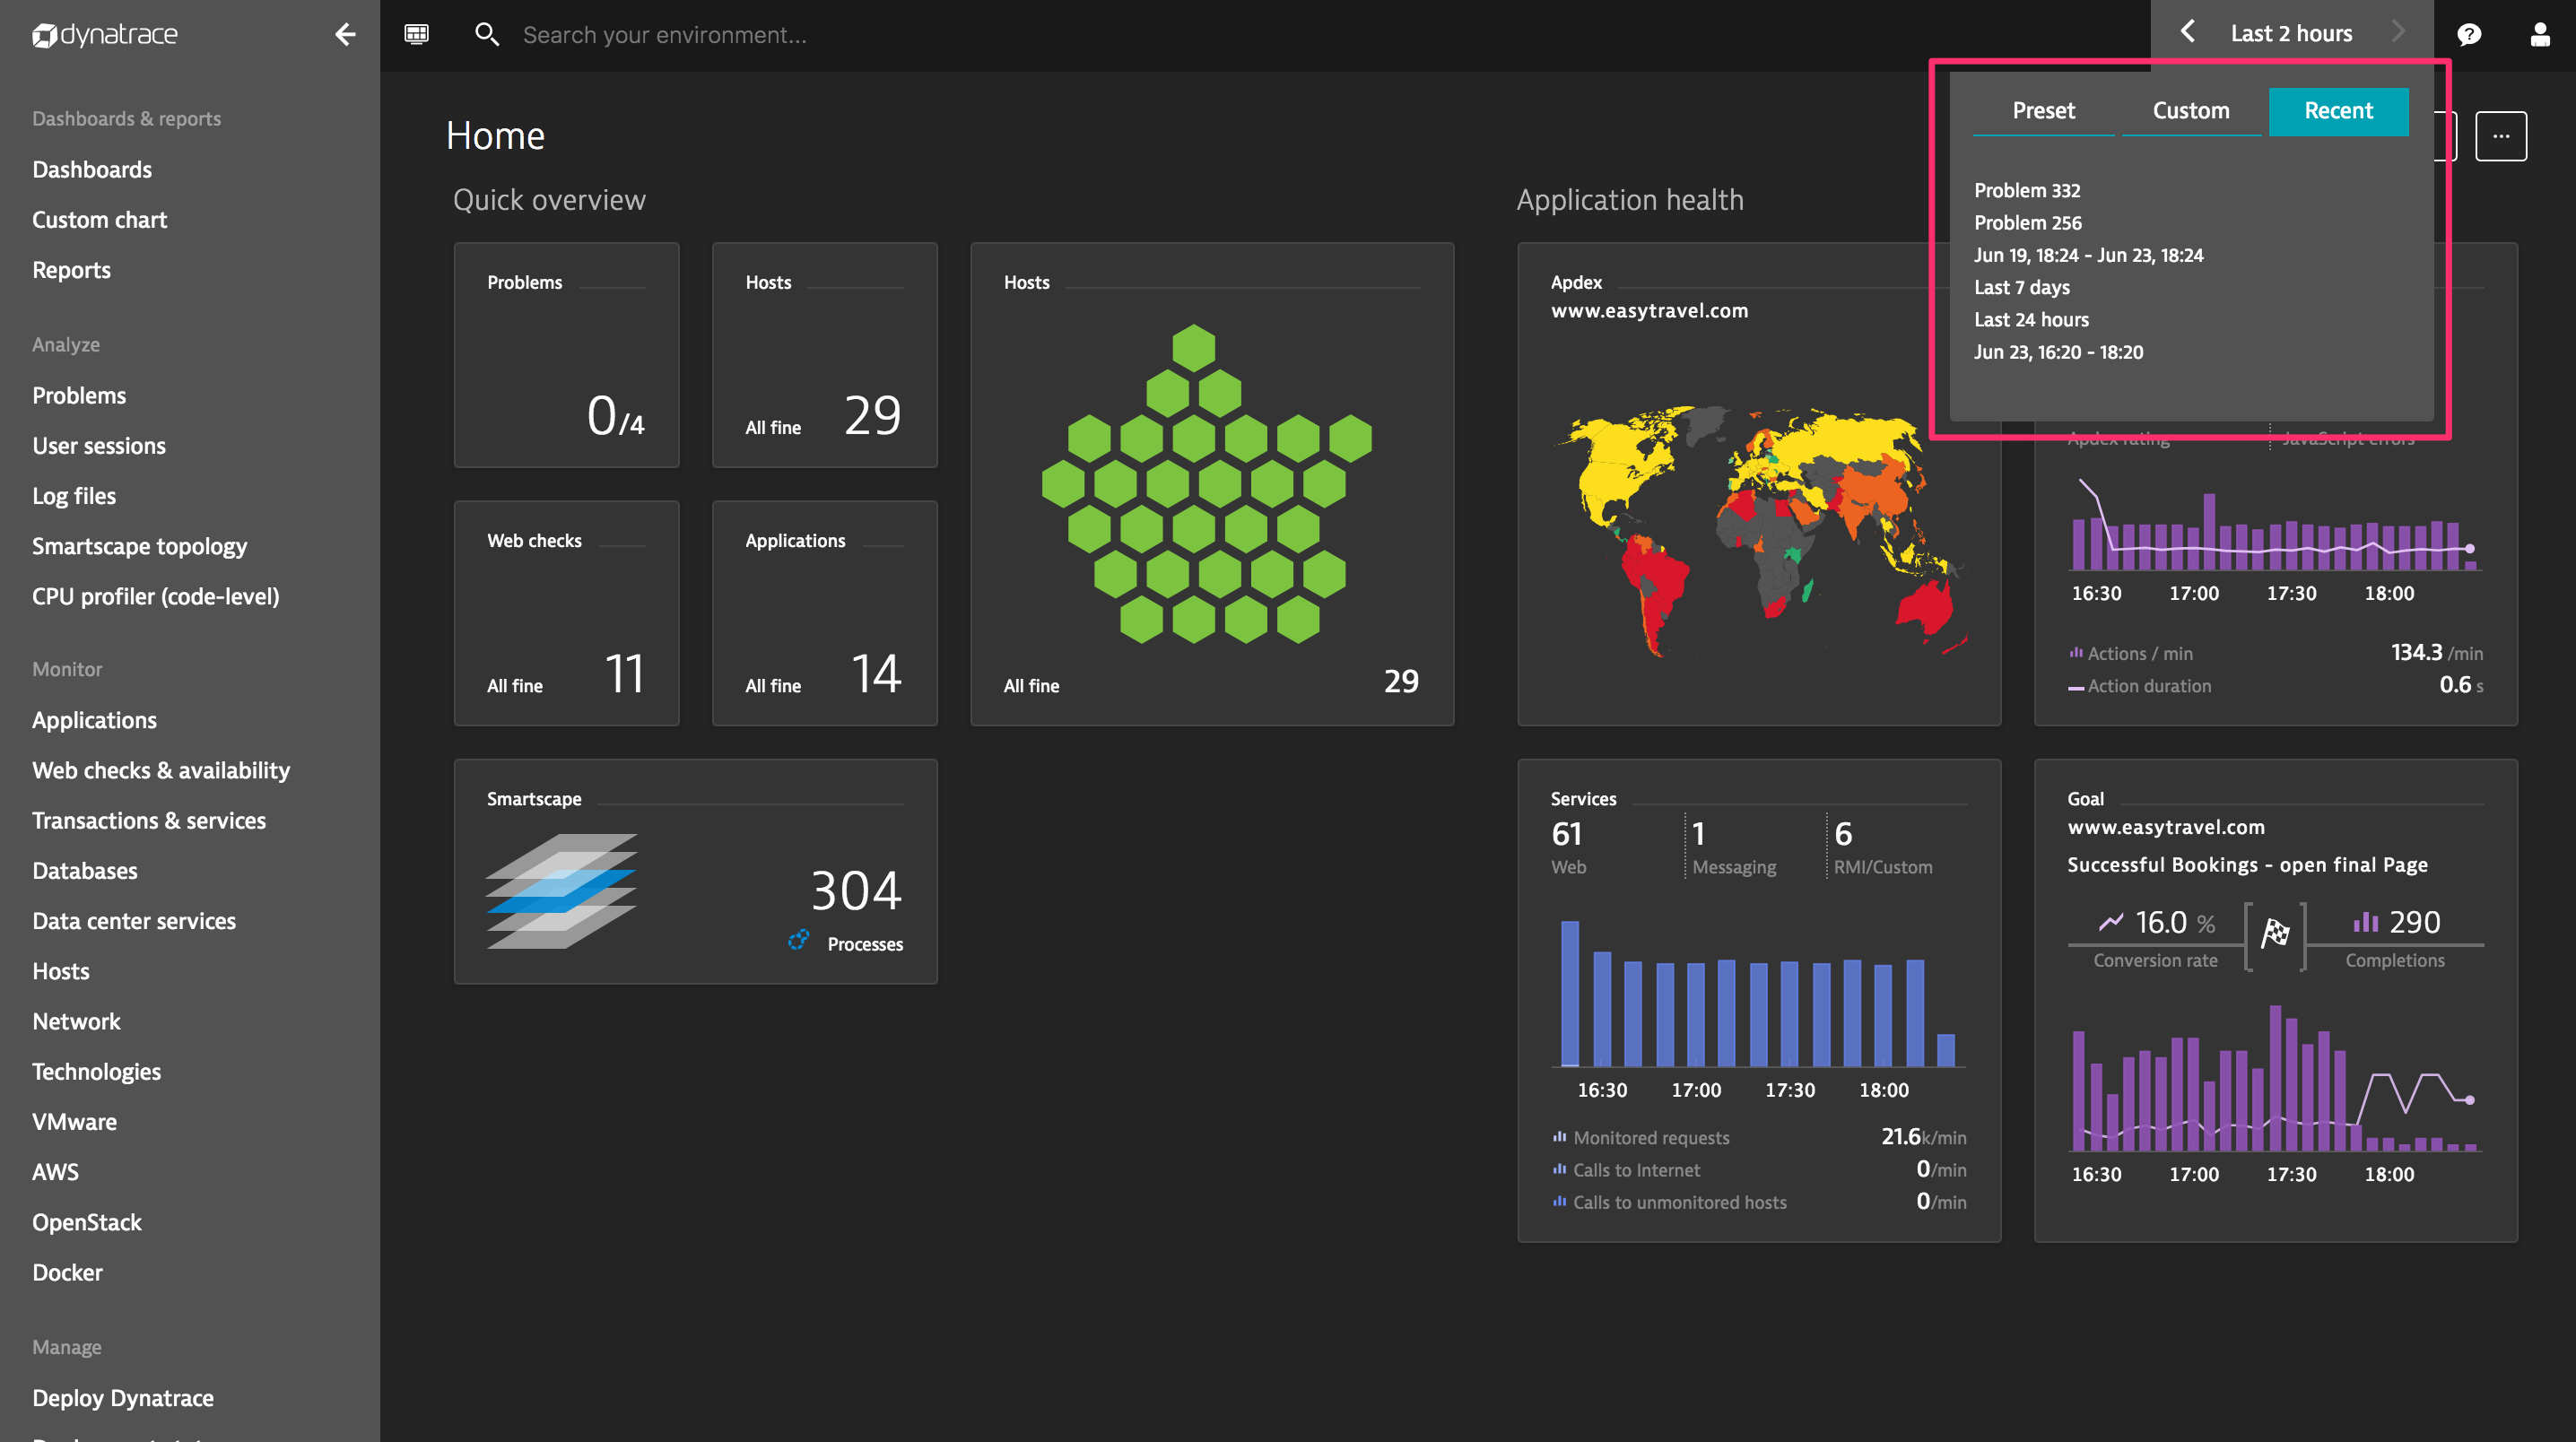
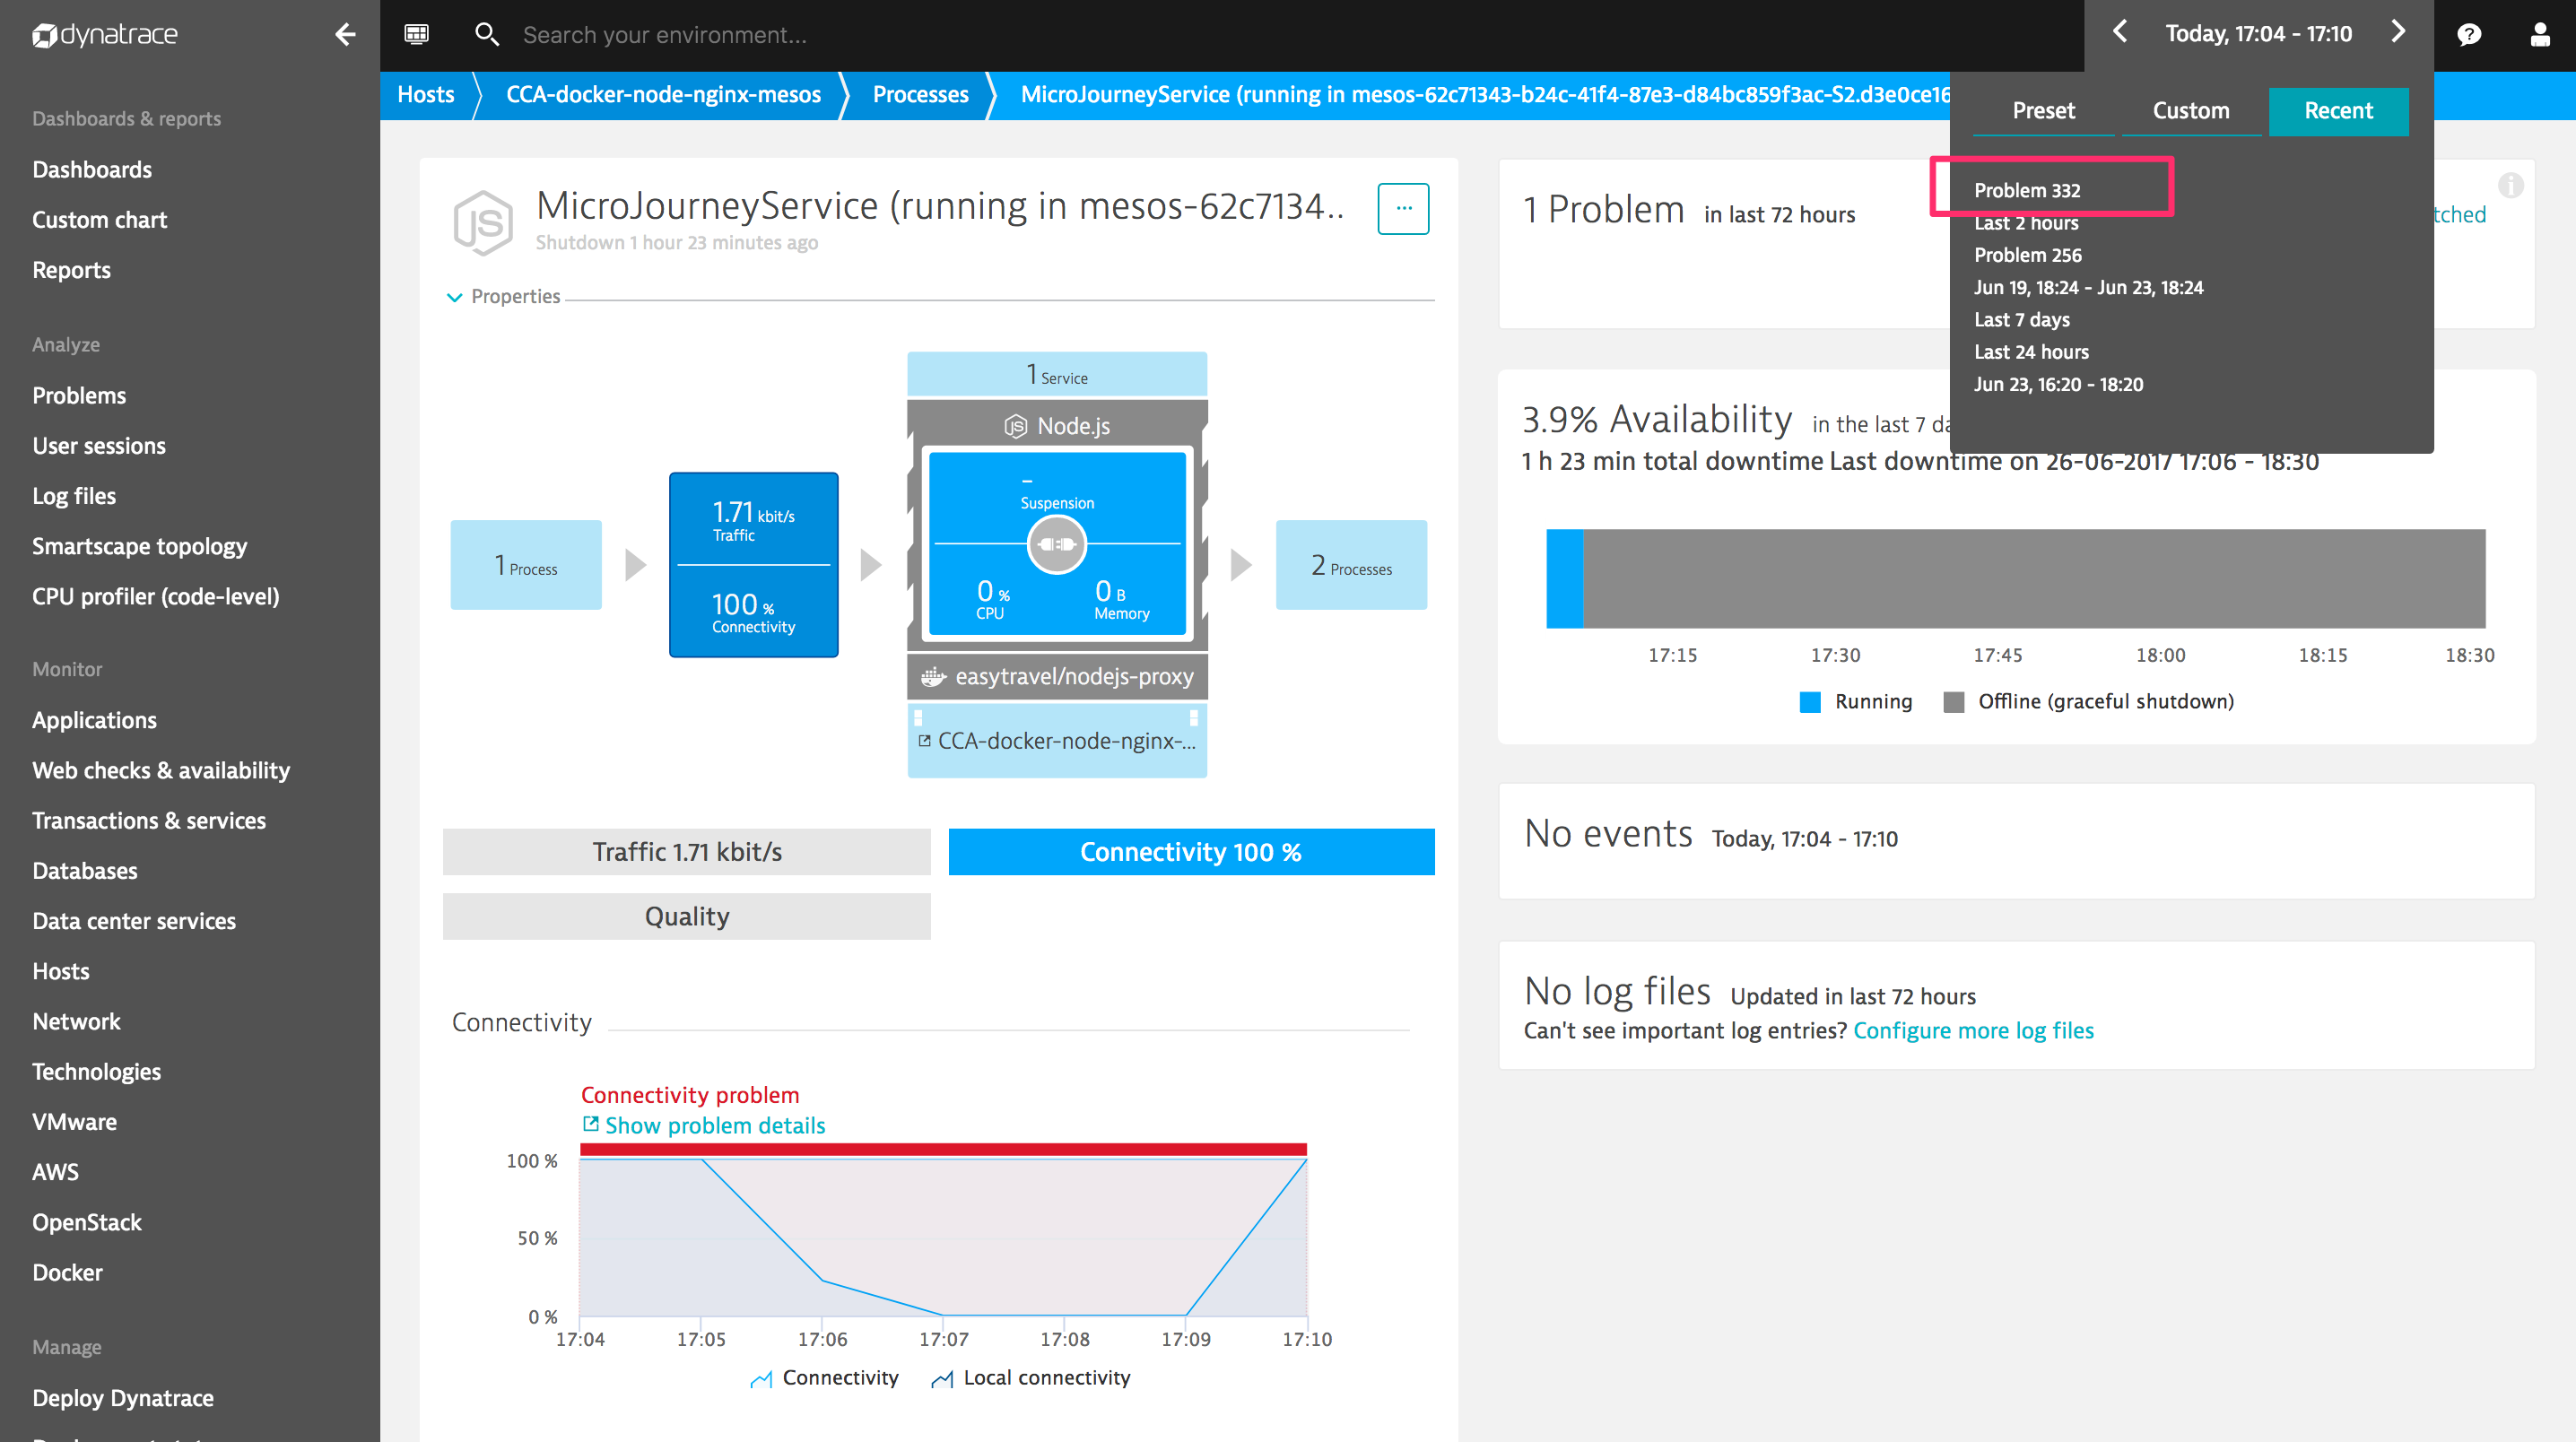
The time frames that you’ve used most recently are always available on the Recent tab so you can easily return to them at any time. Problem-specific time frames generated by Dynatrace root-cause analysis are also retained on the Recent tab. Problem-specific time frames are very useful when dealing with multiple problems in an environment.
Problem-specific time frames
Each Problem page provides links to the overview pages of the entities that are affected by the detected problem (for example, hosts, applications, and processes). Have a look at the Problem page example below that highlights an unavailable process issue. The problem ID number is displayed in the breadcrumb navigation. Notice that Time frame selector is automatically set to the time frame of the detected problem (17:04 – 17:10). This enables you to quickly analyze the performance of other aspects of your environment during the time frame of the problem.
To exit problem analysis view, click the Close problem analysis button in the Time frame selector.
When you close problem analysis view, the time frame of the detected problem is retained on the Recent tab so that you can easily resume problem analysis at any time. To return to the same problem analysis view, click the problem ID on the Recent tab.
As always, your feedback is very important to us. We look forward to hearing your thoughts about the newly redesigned Time frame selector.


Looking for answers?
Start a new discussion or ask for help in our Q&A forum.
Go to forum