
Modern web applications typically feature complex service architectures that can process millions of different types of requests. With each unique request behaving slightly differently and triggering a slightly varied service flow, it can be a real challenge to analyze the performance and behavior of individual requests.
The latest filtering enhancements on all Dynatrace service-analysis pages help you navigate the complexity of your application’s service architecture—enabling you to find the proverbial needle in the haystack.
Advanced filtering for service flows
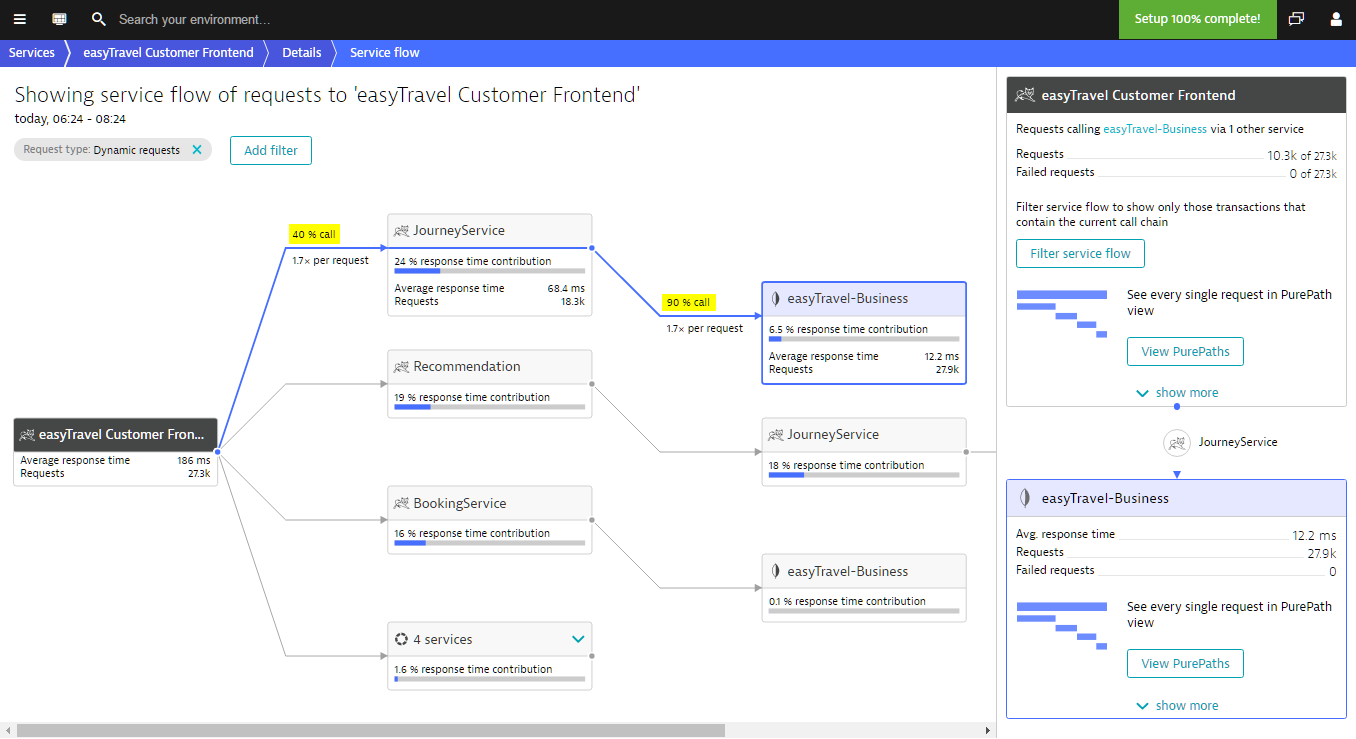
Dynatrace Service flow and Response time analysis views have long enabled you to analyze subsets of requests triggered by a given service. As you can see in the Service flow example below, only 40% of the requests to the easyTravel Customer Frontend service also called the JourneyService service.
Dynatrace now enables you to focus your analysis on specific sets of requests that are involved in specific call sequences.
Filter requests based on specific call sequences
Call sequence filters are available in most service analysis views, but they’re most obvious in Service flow.
Filter requests on the Service flow page
- Click Transactions & services in the navigation menu.
- Select the service you want to analyze.
- Click the Browse (…) button and select Service flow.
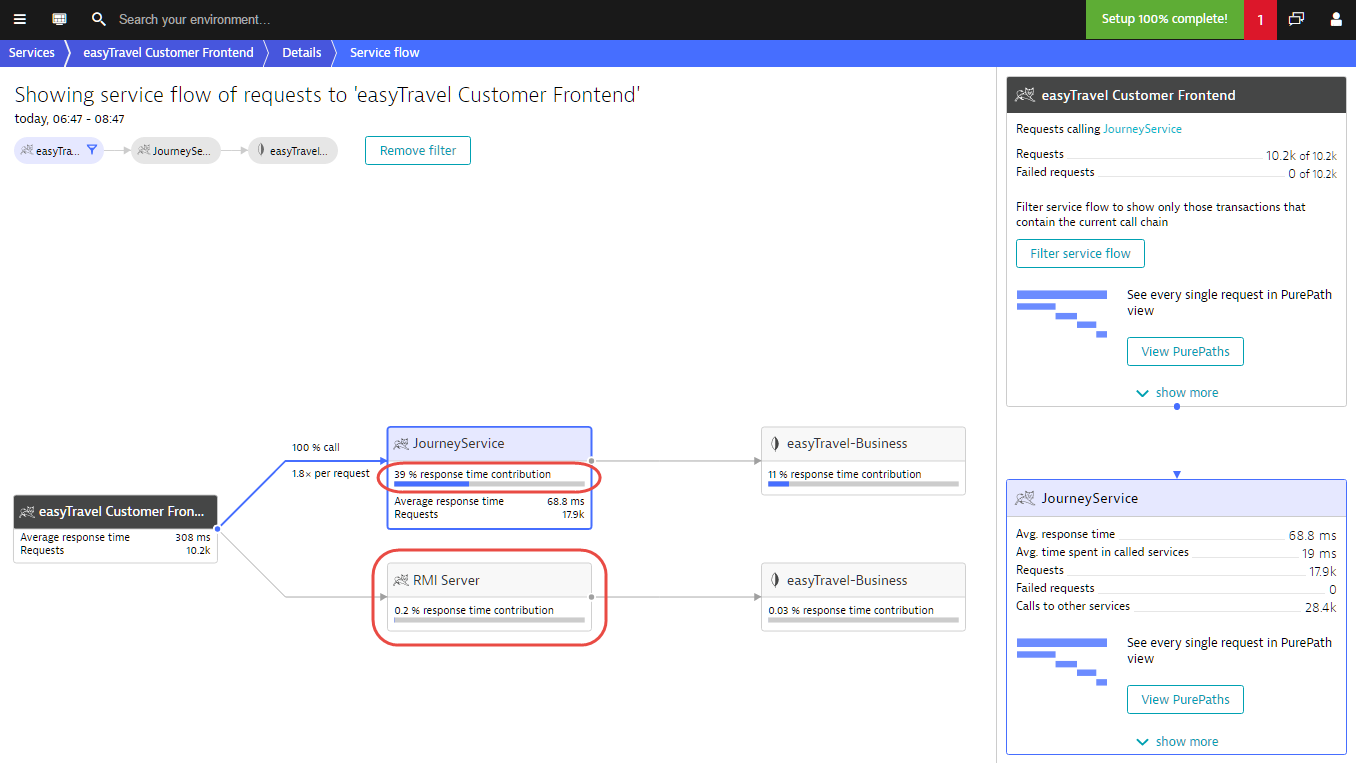
- Within Service flow, select a called service to define the sequence of services you want to analyze.
The Filter service flow button for the selected sequence appears on the right side of the page. - Click Filter service flow to create a filter for the selected service flow.
In the example below, a filter has been created to focus analysis only on those requests from the easyTravel Customer Frontend service that call the JourneyService service and subsequently call the easyTravel-Business database. Notice that the number of requests analyzed on easyTravel Customer Frontend has been reduced, as only a subset is now taken into account. Consequently the average response time now represents only those easyTravel Customer Frontend requests that call JourneyService. Now take a close look at the JourneyService node. Note that 39% of the easyTravel Customer Frontend service’s response time is taken up by JourneyService. Service flow also reveals something unexpected—some of the selected requests trigger the RMI server.
Create multi-faceted filters
Each filter can contain multiple call sequences. This means you can create complex, multi-faceted call-sequence filters based on your unique service-analysis needs. Just click additional call sequences in Service flow and click the View service flow button to add the new sequences to the existing filter.
Analyze call sequences from multiple angles
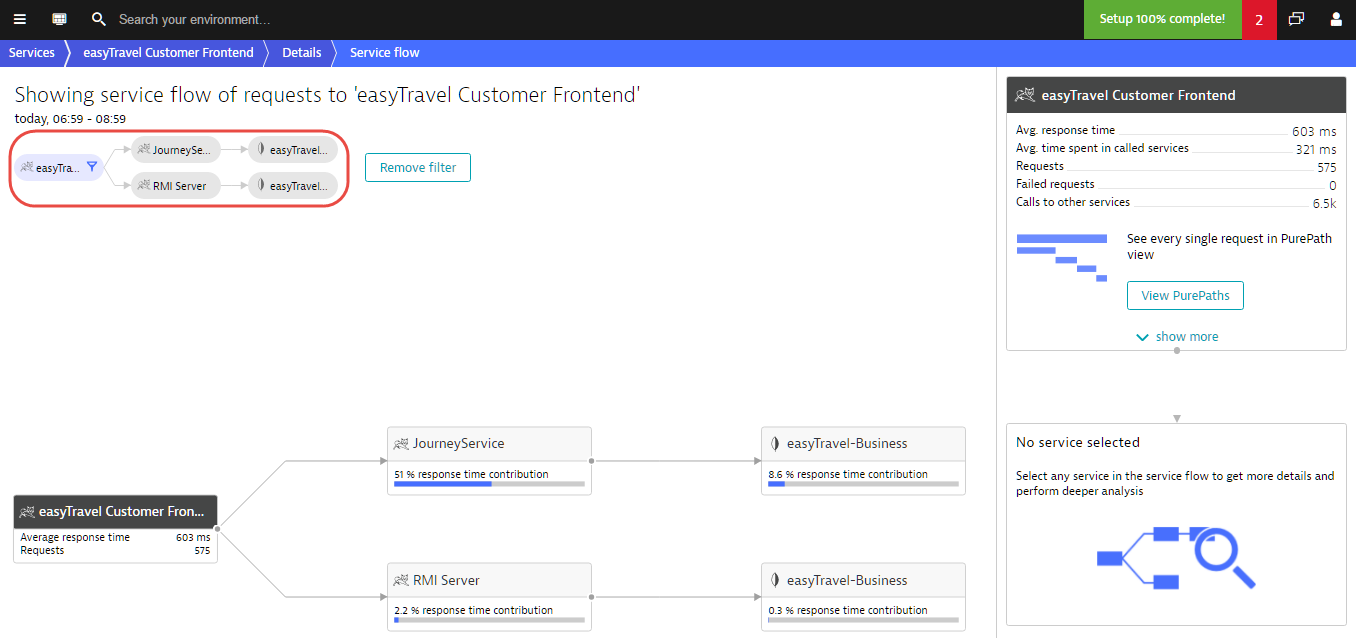
The true power of call-sequence filtering becomes apparent once you begin analysis of a problematic call sequence. Continuing with the example above, Service flow now shows us that half of the easyTravel Customer Frontend service’s response time is taken up by JourneyService.
The next logical step is to analyze the response time of the JourneyService service in the context of the selected call sequence. To do this, simply click the JourneyService box within Service flow. The right-hand pane expands, revealing all of the types of Dynatrace analysis that you can perform on this service (PurePath, service-level backtrace, response time distribution, and more)—all within the context of the filtered call sequence.
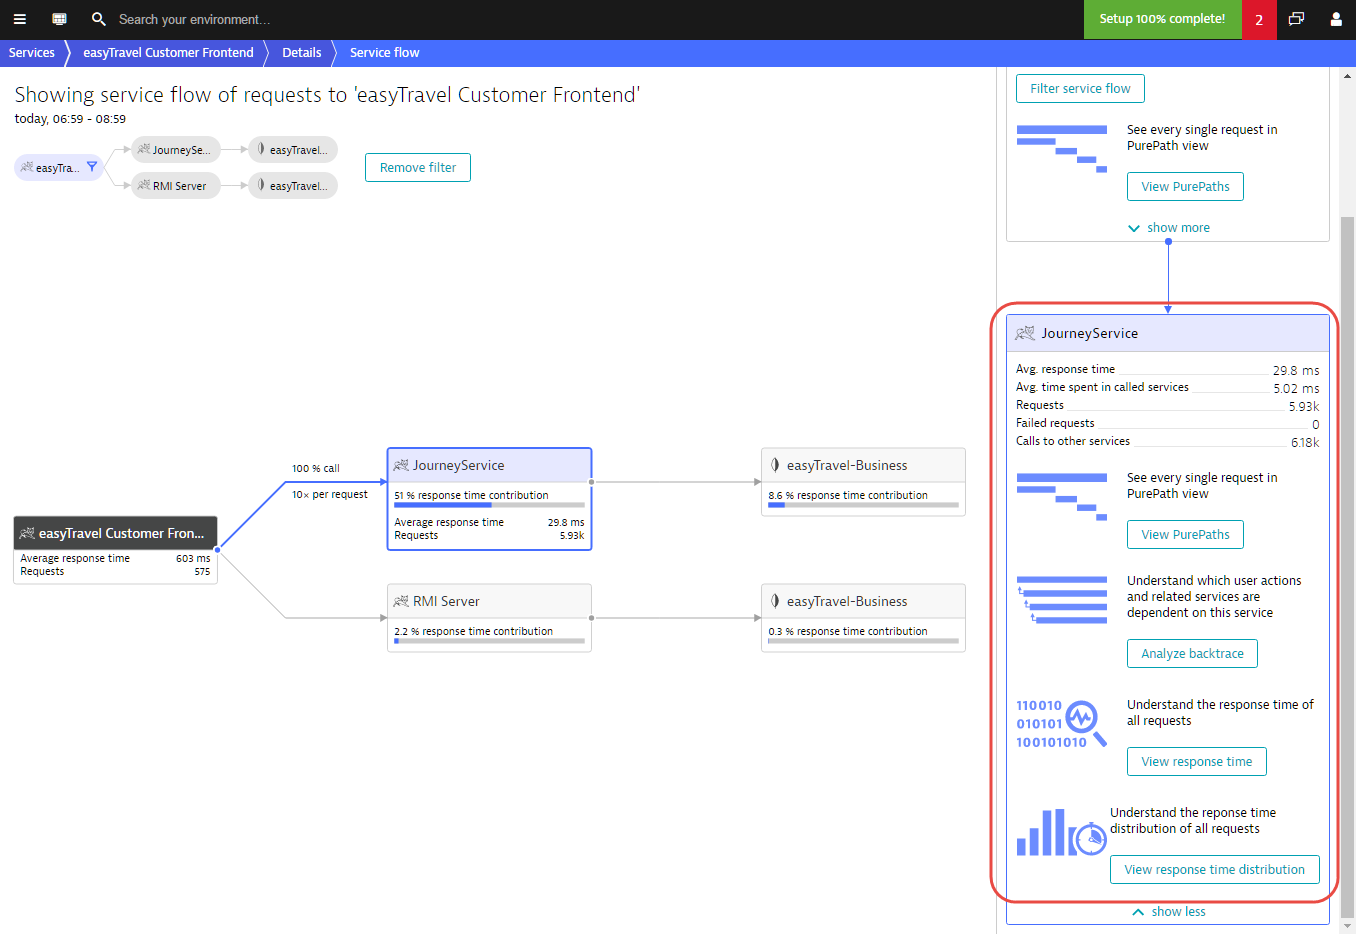
Because service flow filters remain persistent across all analysis views, your analysis remains focused on the exact call sequence that you’re interested in as you step through all available analysis.
In the example below, Response time analysis shows how well JourneyService performs when it’s called by easyTravel Customer Frontend and subsequently calls the database—while easyTravel Customer Frontend simultaneously calls RMI Server, all within the same requests.
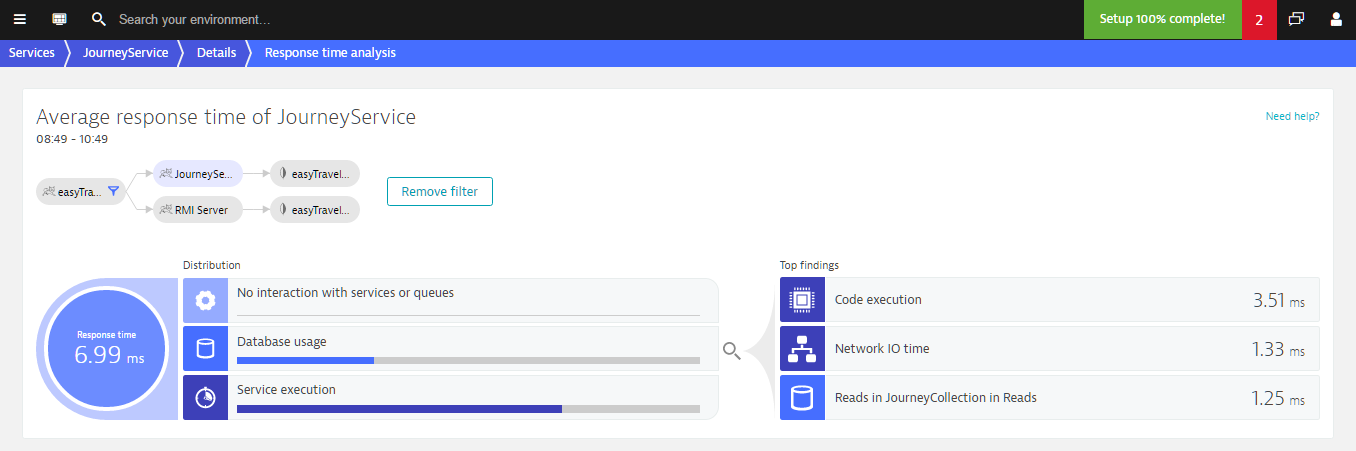
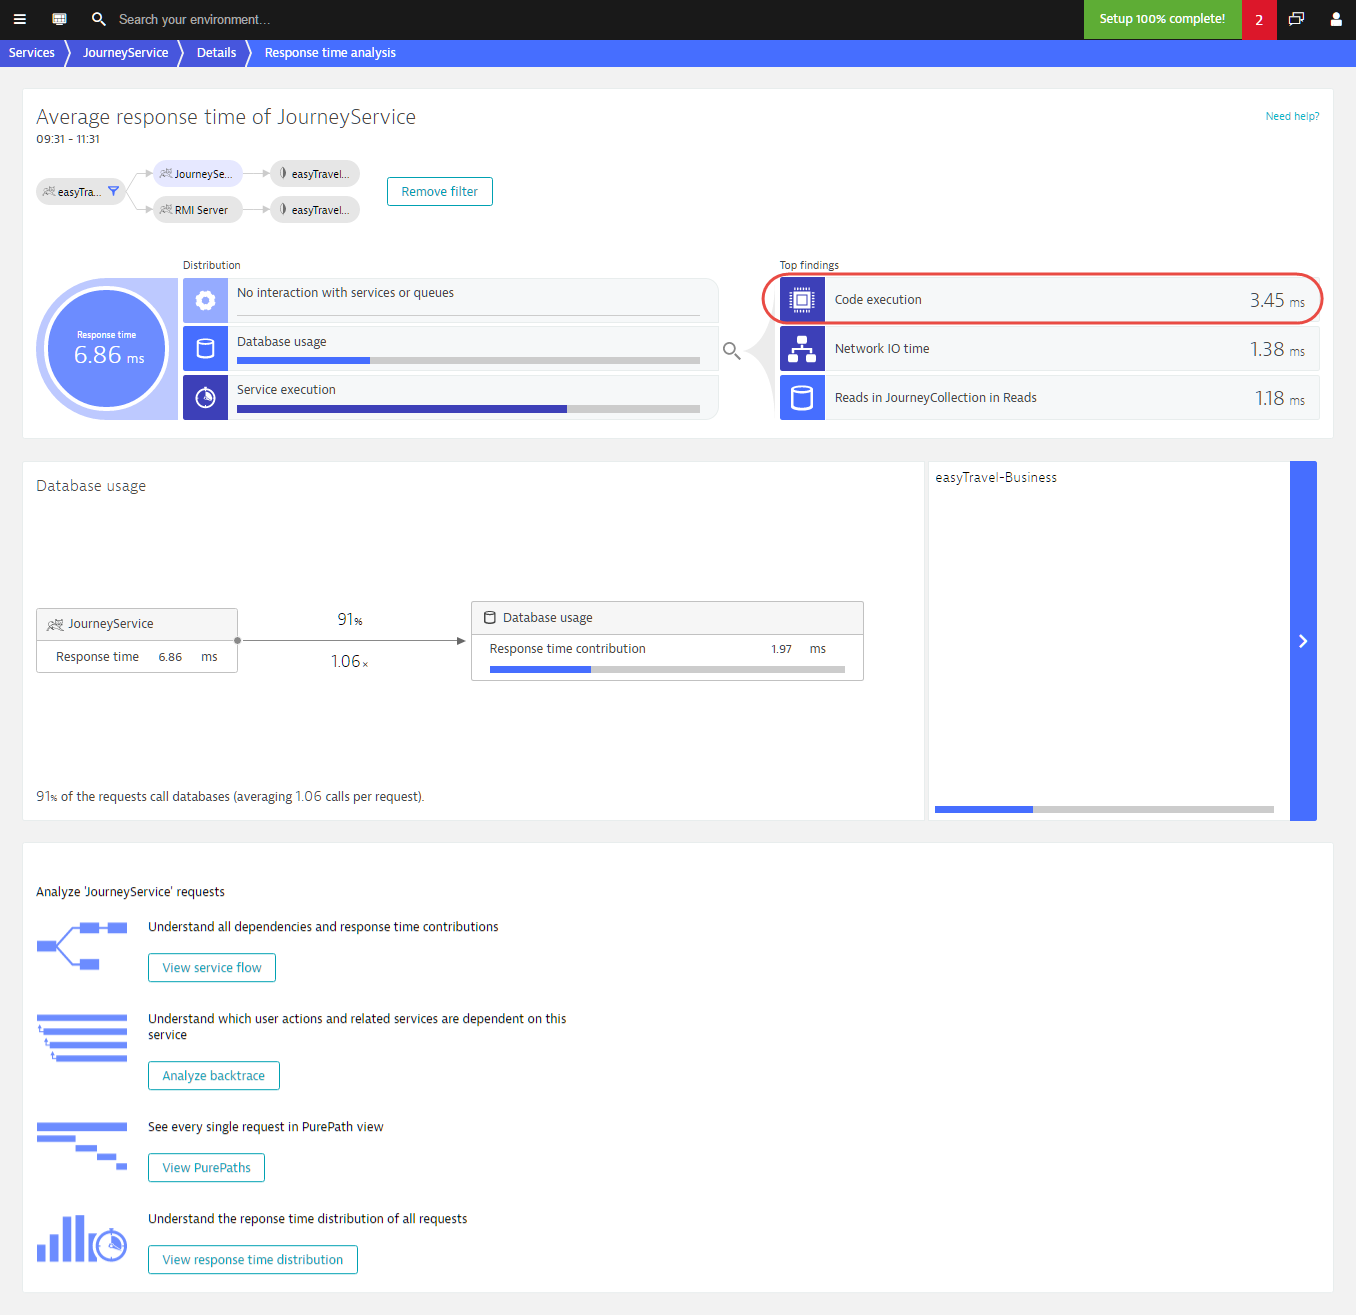
In this case, most of the time is spent in Code execution. This drill down functionality is now available in all analysis views.
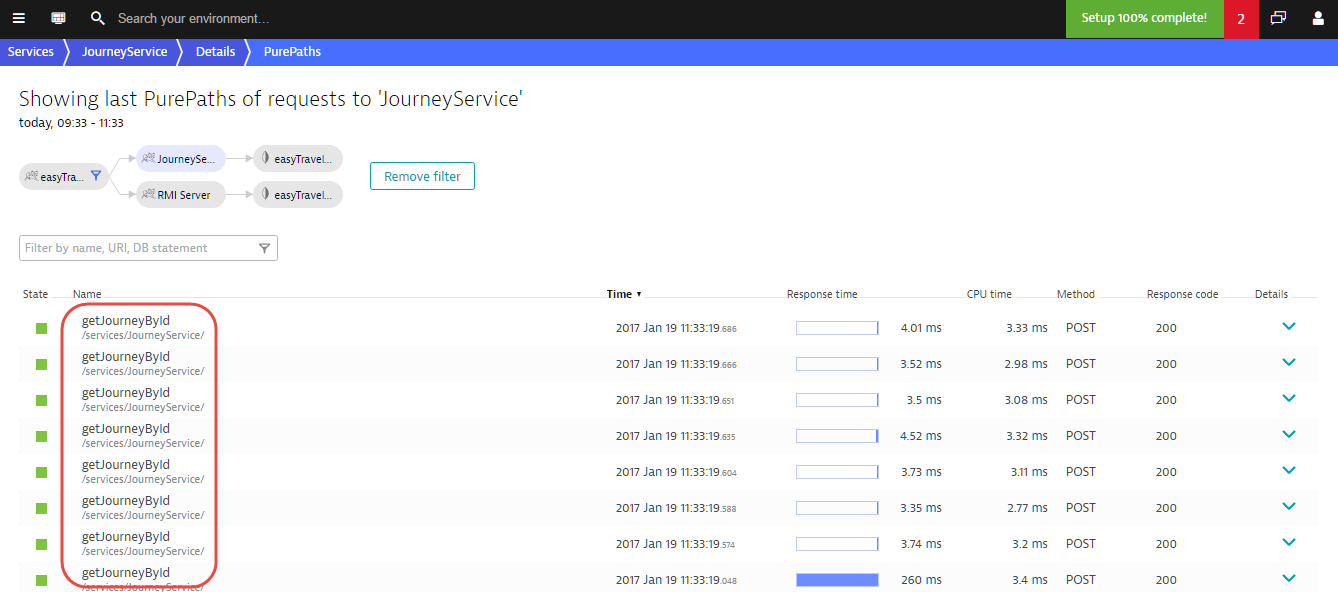
You can even view each of the individual PurePaths that relate to the selected call sequence. This PurePaths view shows each JourneyService call as an individual request—each of which can be analyzed separately.
Extend your filters with additional criteria
As you can see in the PurePaths view example above, most of the JourneyService requests are fast, but one is rather slow. Continuing our analysis, it makes sense to now focus on those JourneyService requests that exceed a certain response time threshold. To do this, click the JourneyService node within the filter visualization. This opens up a new pane with controls you can use to refine your filter based on a specific Response time threshold, a specific CPU time threshold, a Response code, Failed requests, a specific HTTP method, or a specific Request. This functionality is now available across all analysis views.

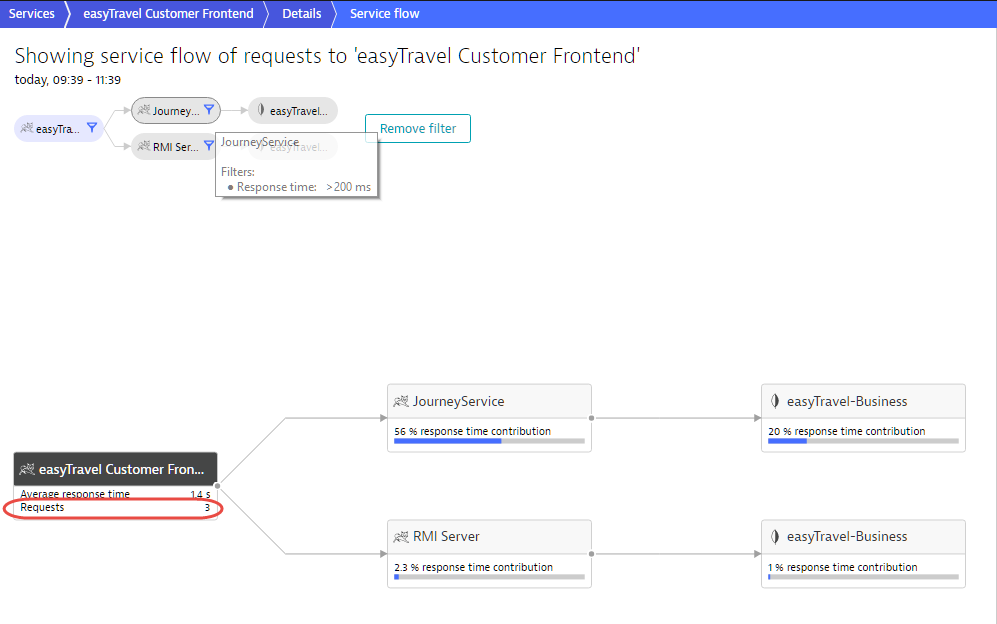
You can define such specific filter criteria for each filter node. Looking at the Service flow example below, you can see that we’ve narrowed our analysis down to 3 requests! These are the only 3 requests within which the JourneyService response time is slower than 200 ms and the RMI Server requests are slower than 20 ms. We’re now very close to finding the needle in this haystack!
Multi-step analysis
Call-sequence filtering can be particularly useful when you’re analyzing a service and the need arises to analyze a different service within the context of the same call-sequence. Note in the Response time analysis example below that the same subset of requests (calls made by easyTravel Customer Frontend to JourneyService) is shown. The analysis shows that the JourneyService is executed in 38% of the easyTravel Customer Frontend requests.
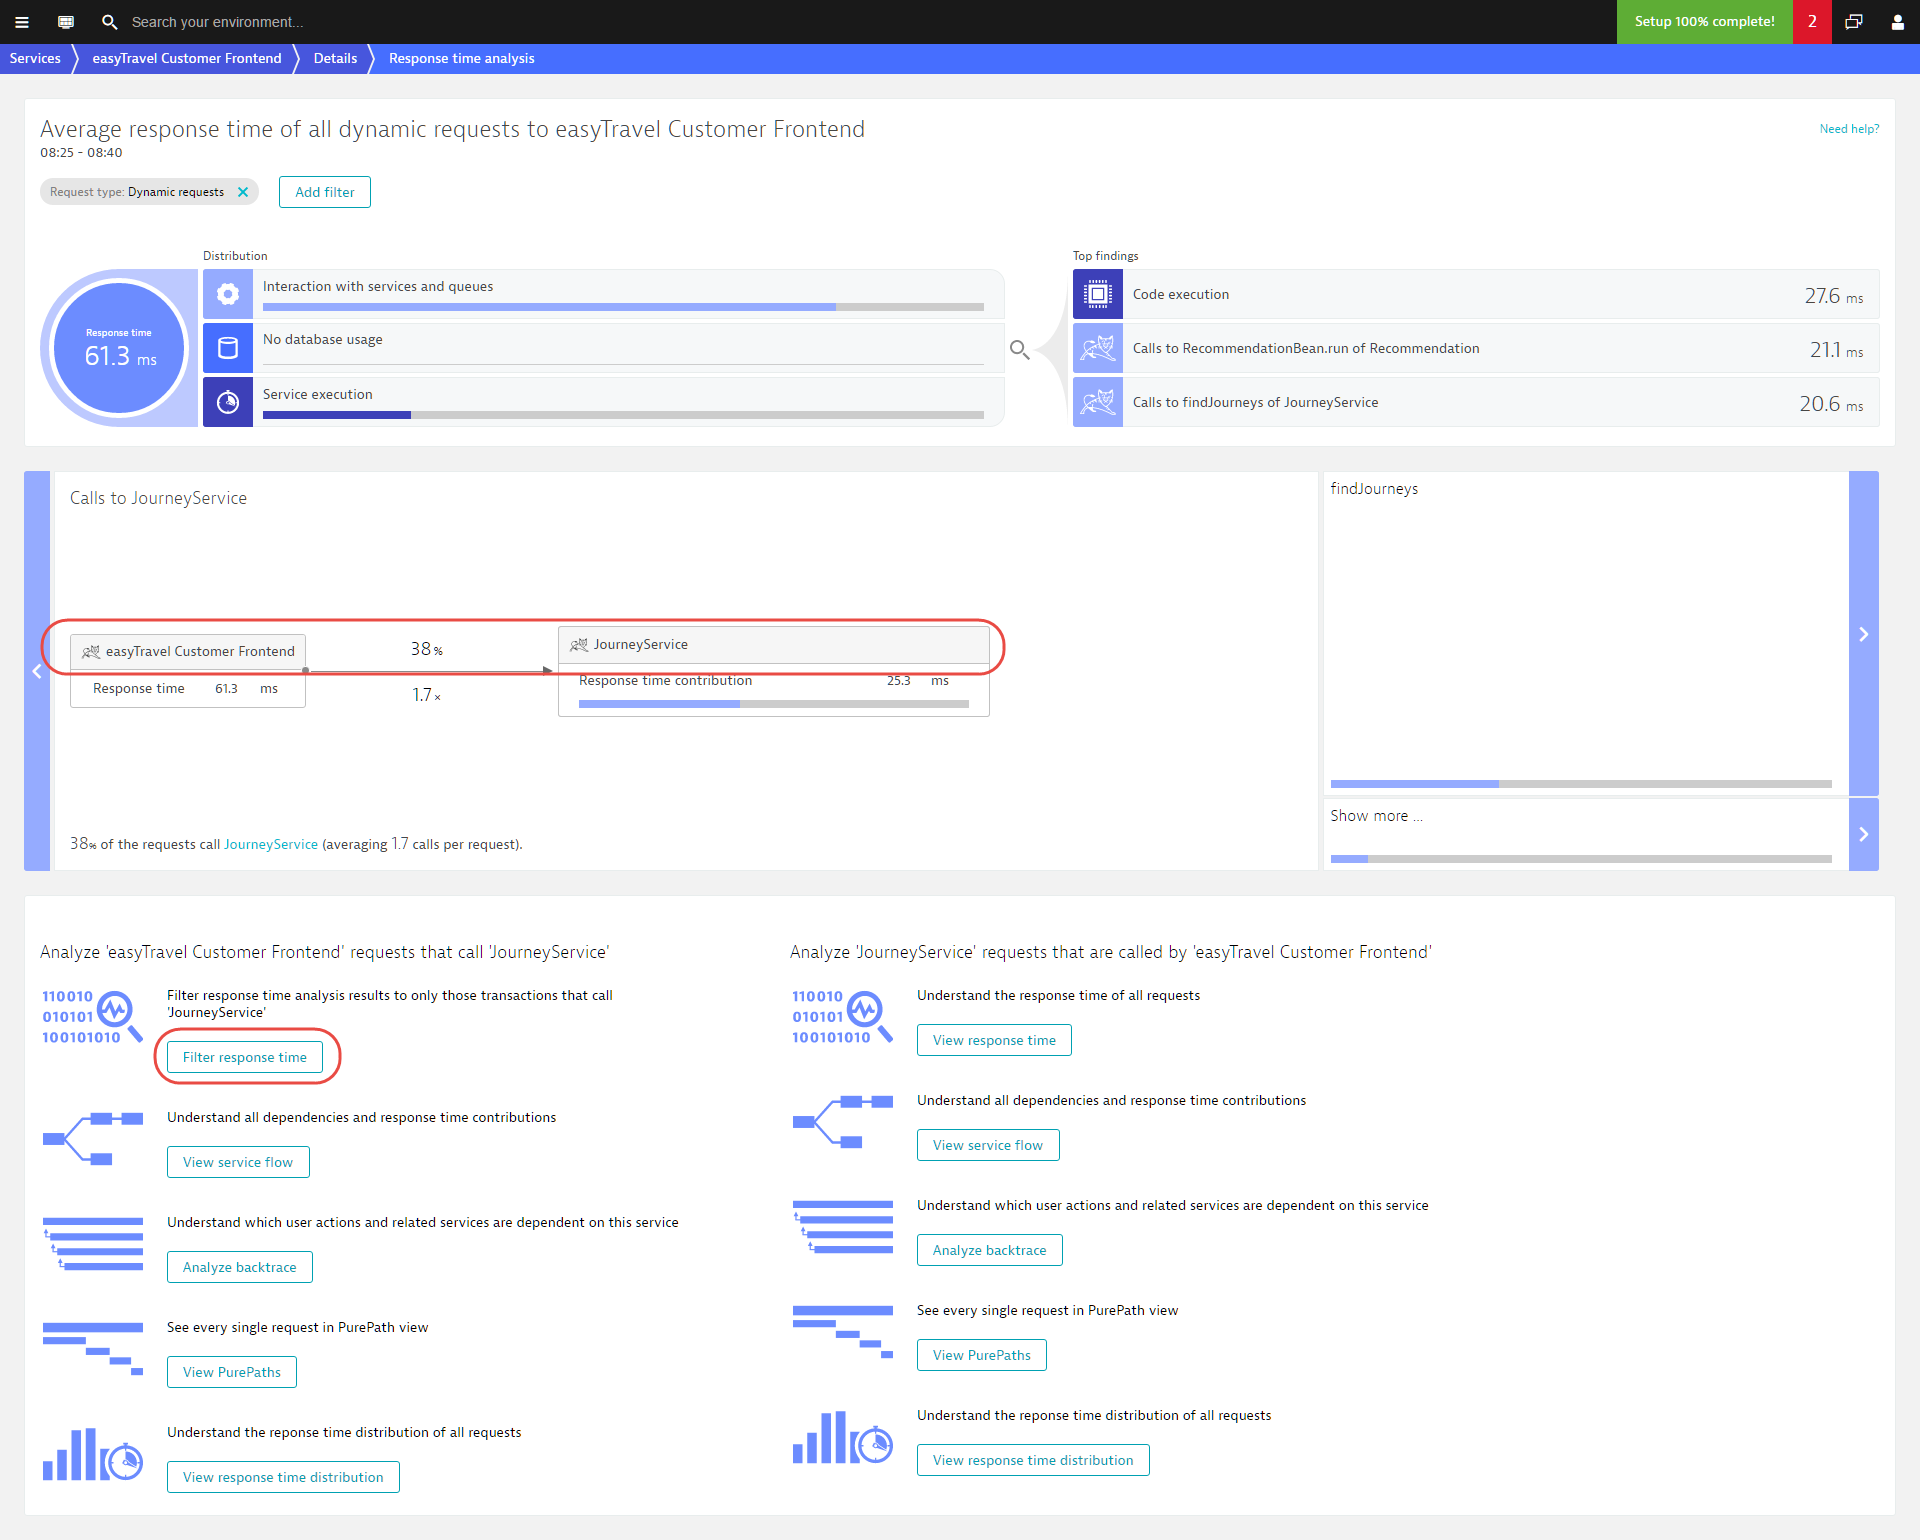
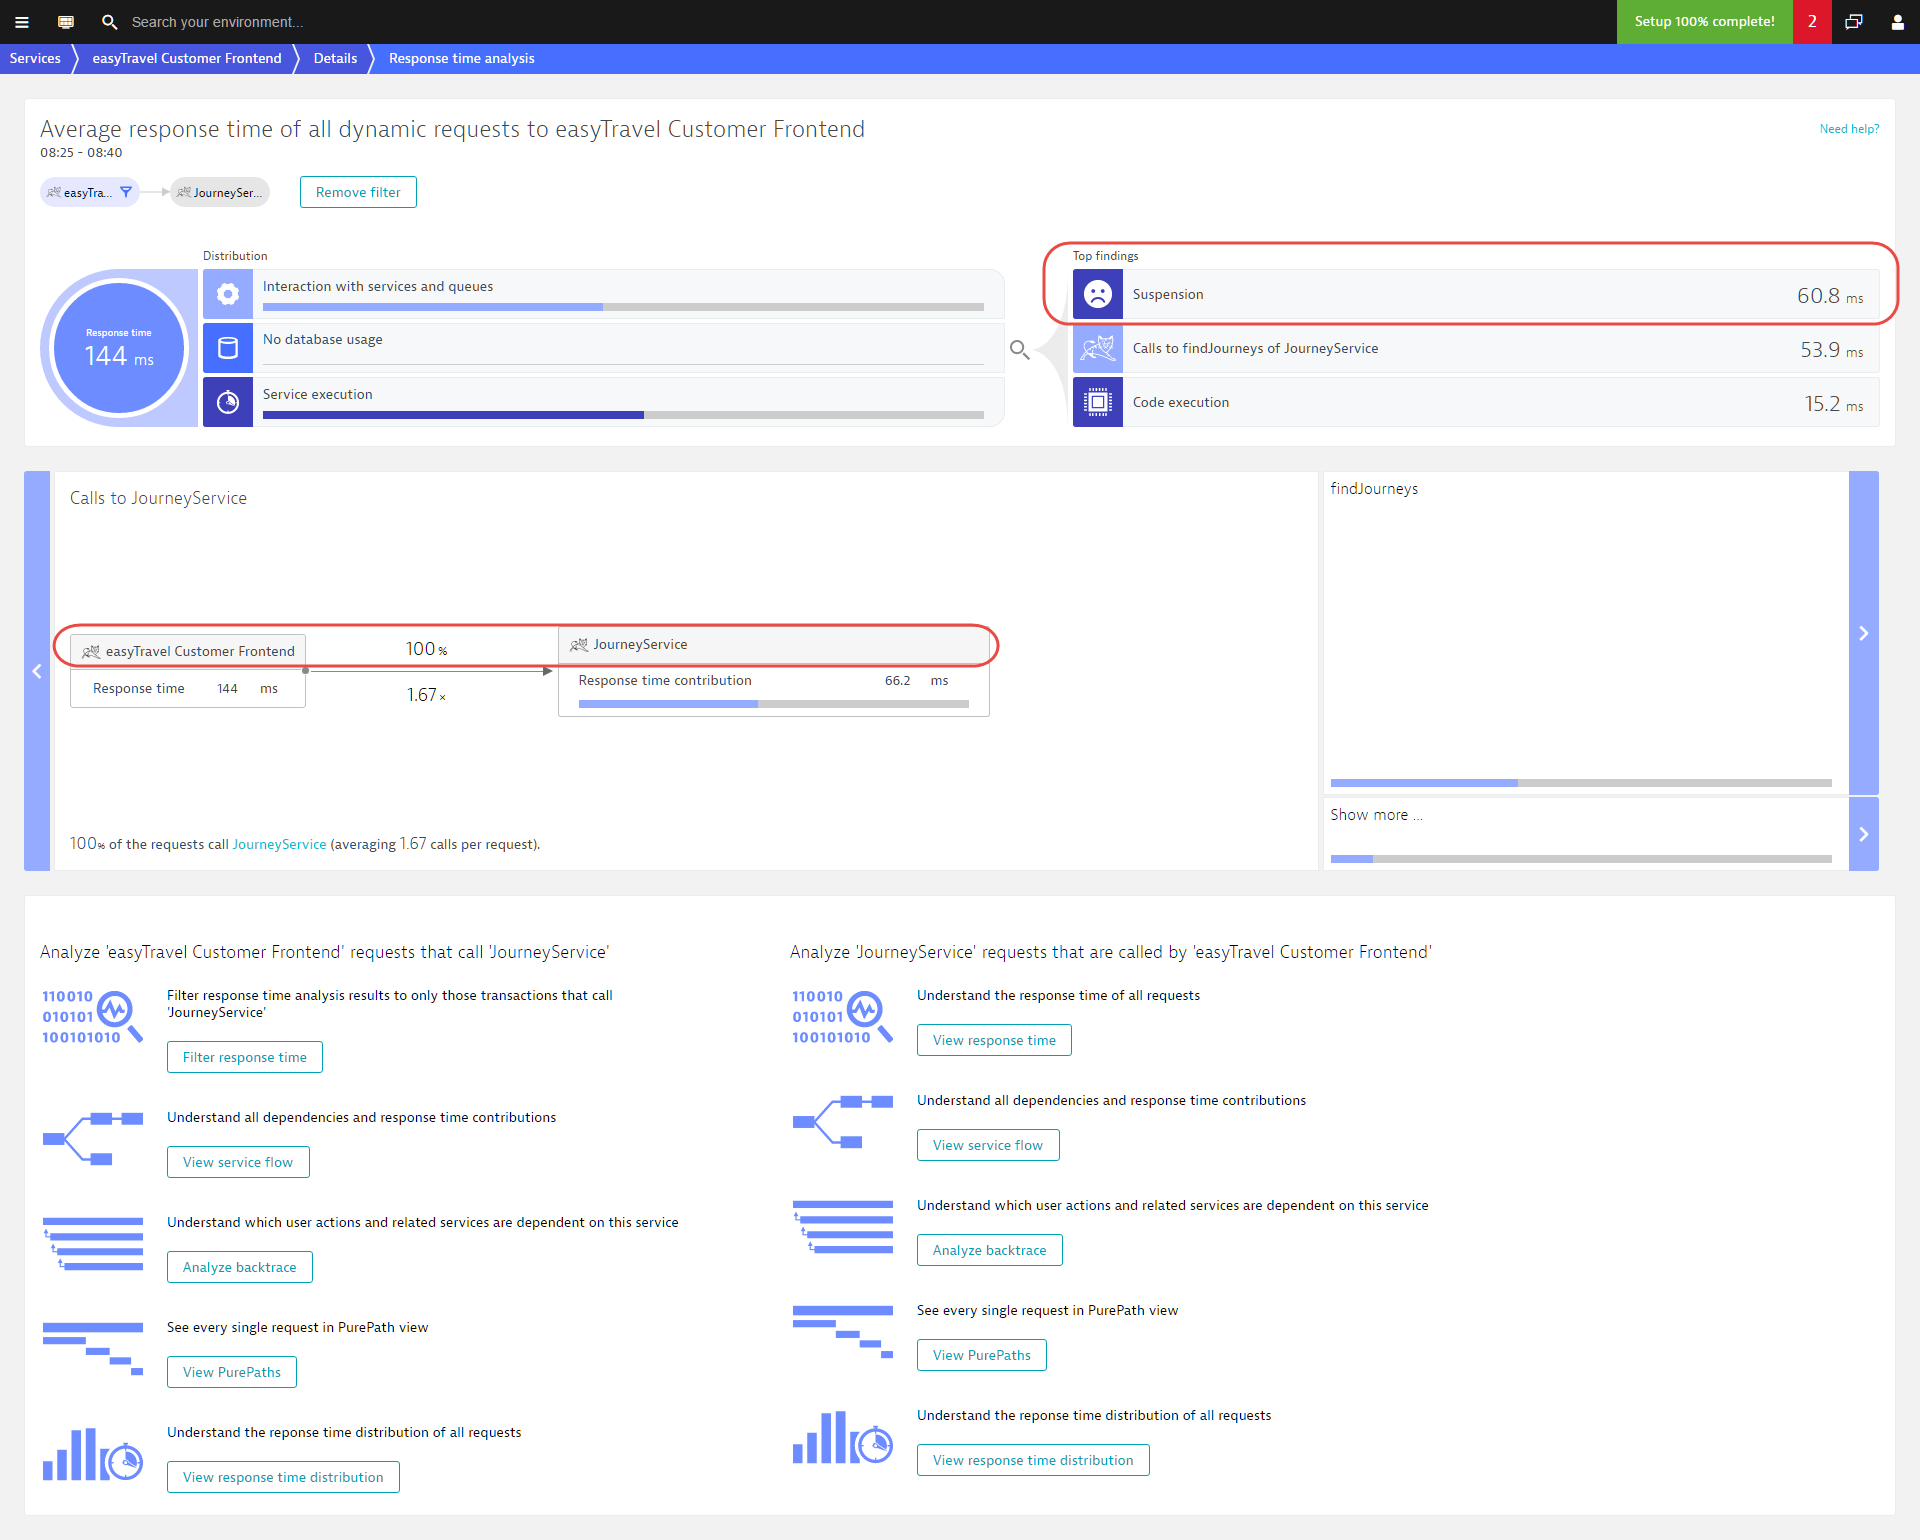
Using the Filter response time button, we can focus analysis on only those transactions that execute the given request. What we see now is that the selected requests all seem to suffer from GC suspension. Also note that the response time contribution of the JourneyService has increased. This makes sense. Whereas in the first analysis JourneyService was only called in 38% of the requests, it is now present in 100% of requests. Consequently, it now contributes more to the overall response time.
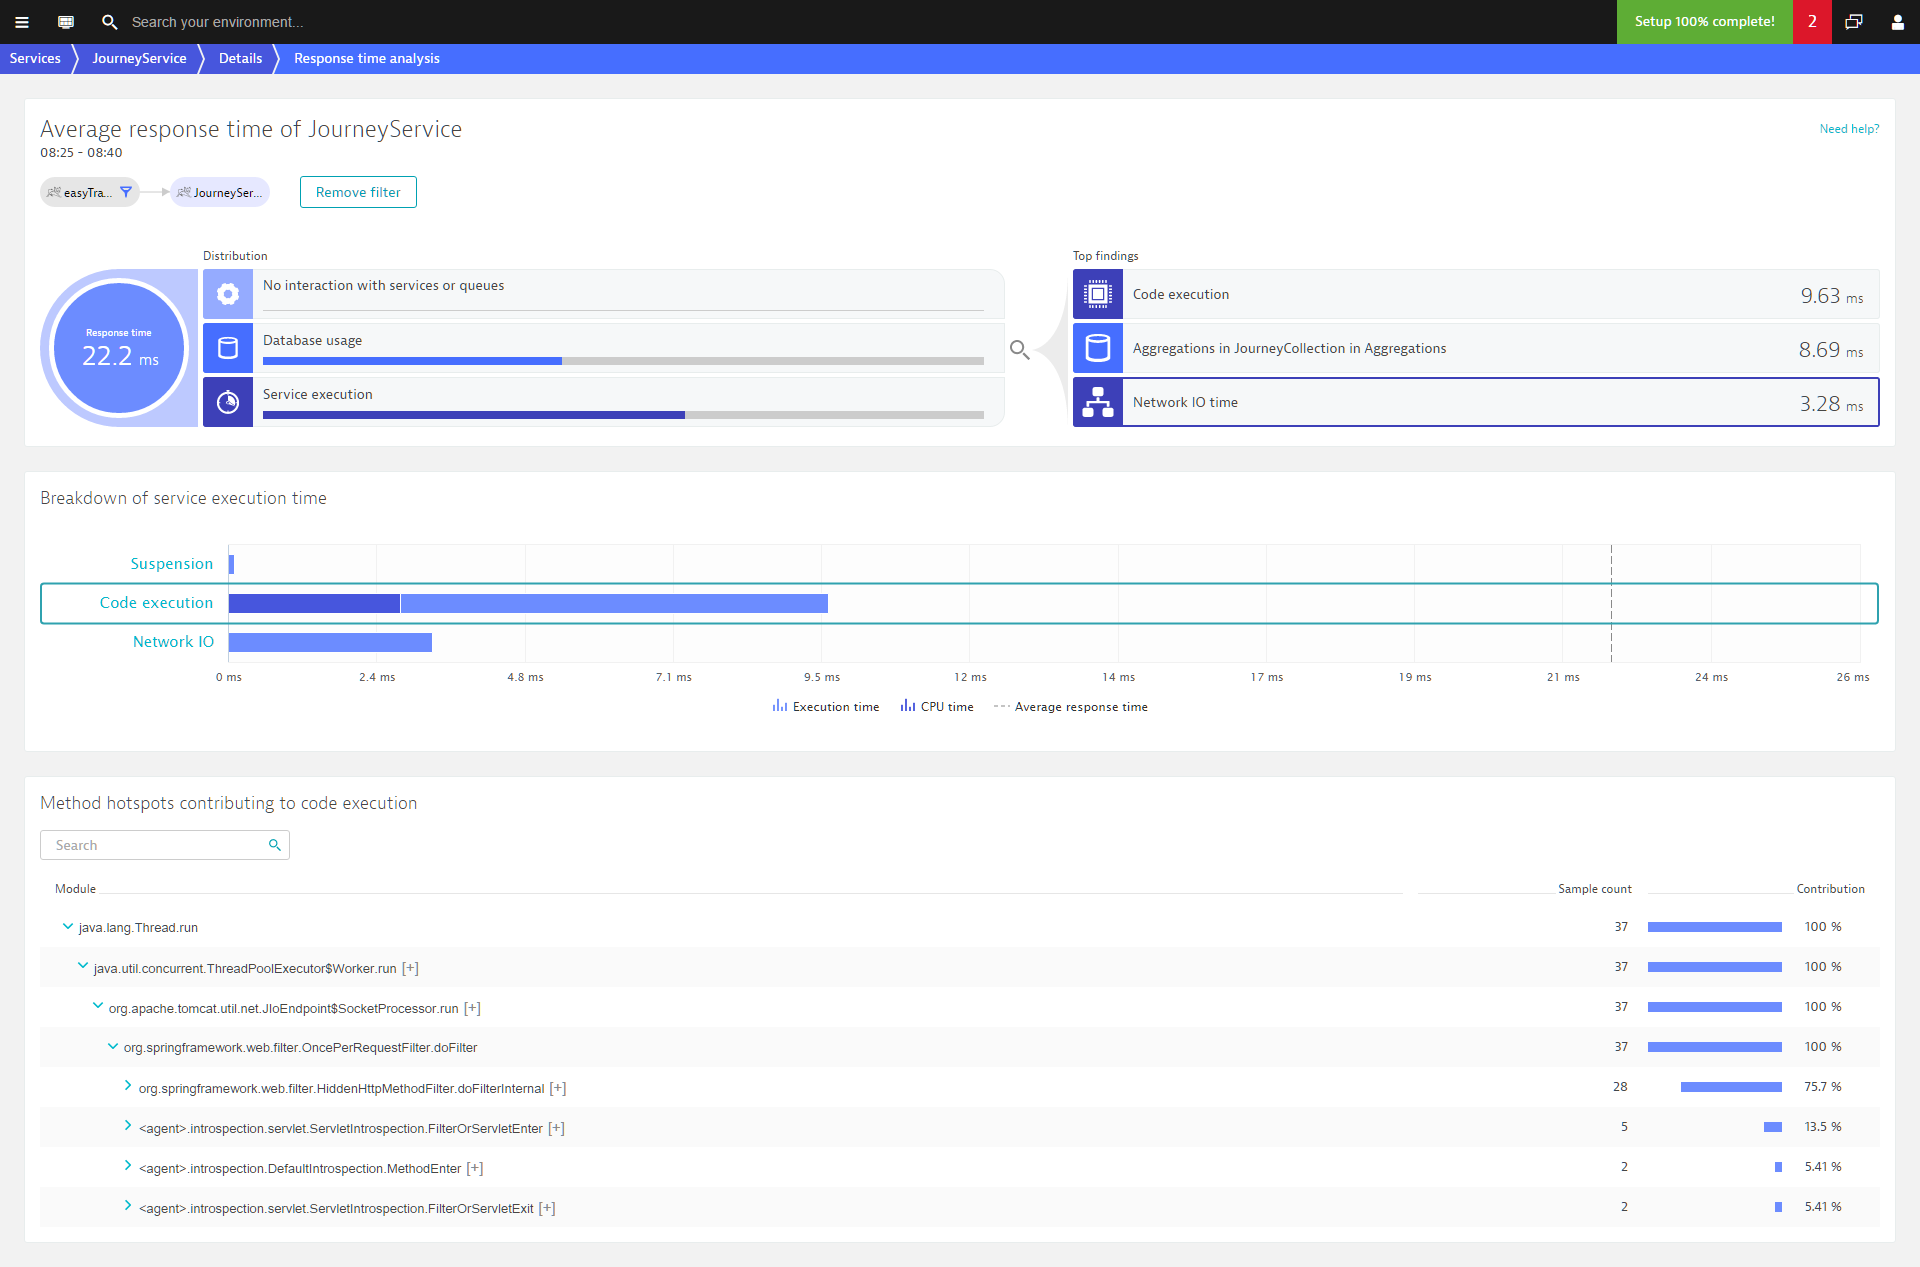
The next logical step is to analyze JourneyService itself and try to understand its response time. Simply clicking the View response time button on the right side will do this for us. The result is a Response time analysis of the JourneyService when it is being called by easyTravel Customer Frontend.
Impact analysis of slow database statements
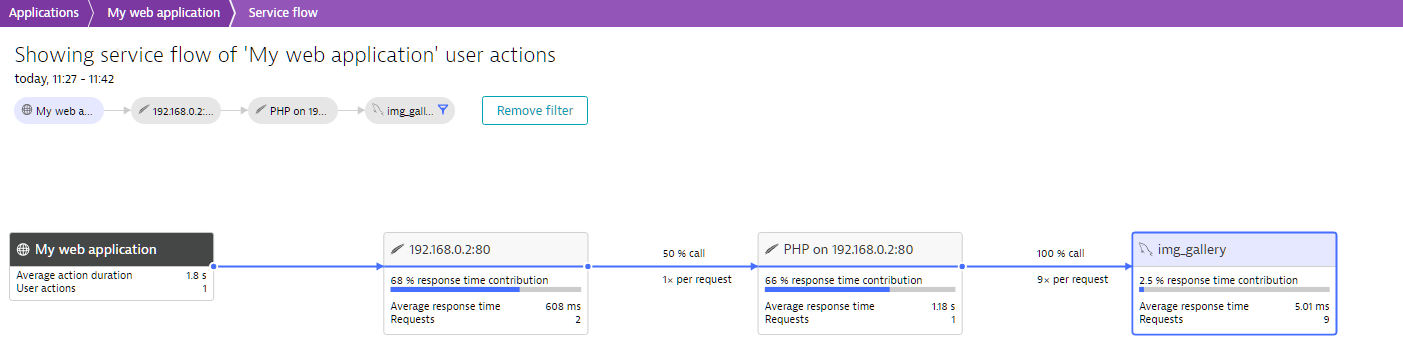
Call sequence filters are particularly powerful within Service-level backtrace view, as shown below. Here you can see the backtrace of the database where database requests are slower than 10 ms. It turns out that only a single user action is affected by the img_gallery database statement: click on “Gallery”.
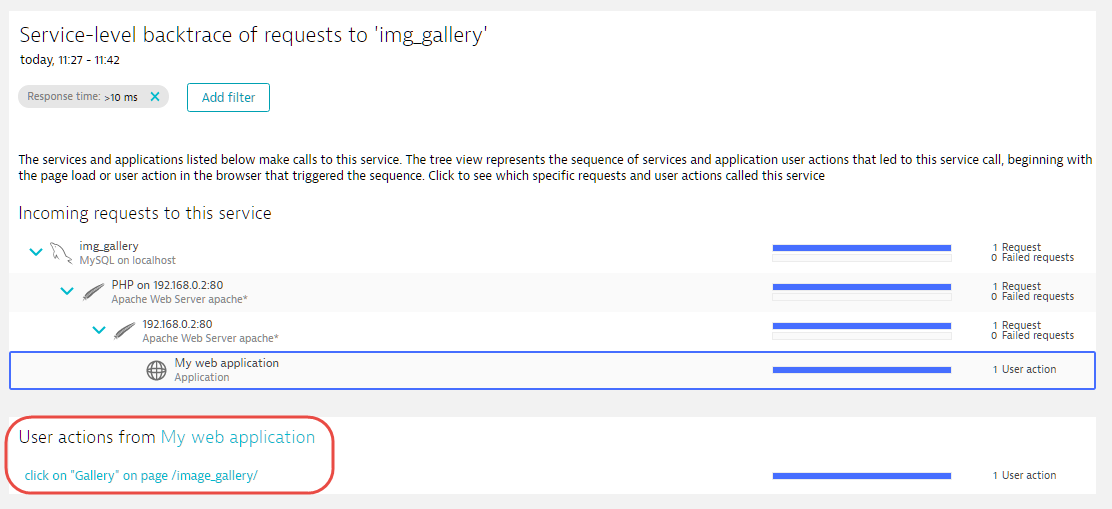
Not only have we now identified which exact click triggered the slow database call, we can reverse the analysis and look at the flow that led up to the SQL call by performing a drill-down of My web application within Service flow view.
This is just the beginning! Dynatrace filters can reveal much more than slow response times. Try the filters out for yourself and let us know what you think about this powerful functionality. And look forward to more filtering enhancements to arrive in the coming weeks.


Looking for answers?
Start a new discussion or ask for help in our Q&A forum.
Go to forum