
Dynatrace Service flow is very useful for understanding what your services and requests are calling across your service landscape. To date, Service flow has only shown which services are called. We’ve now extended Service flow to reflect an important dimension: your underlying infrastructure, including hosts, processes, and load balancers.
Load balancers and proxies
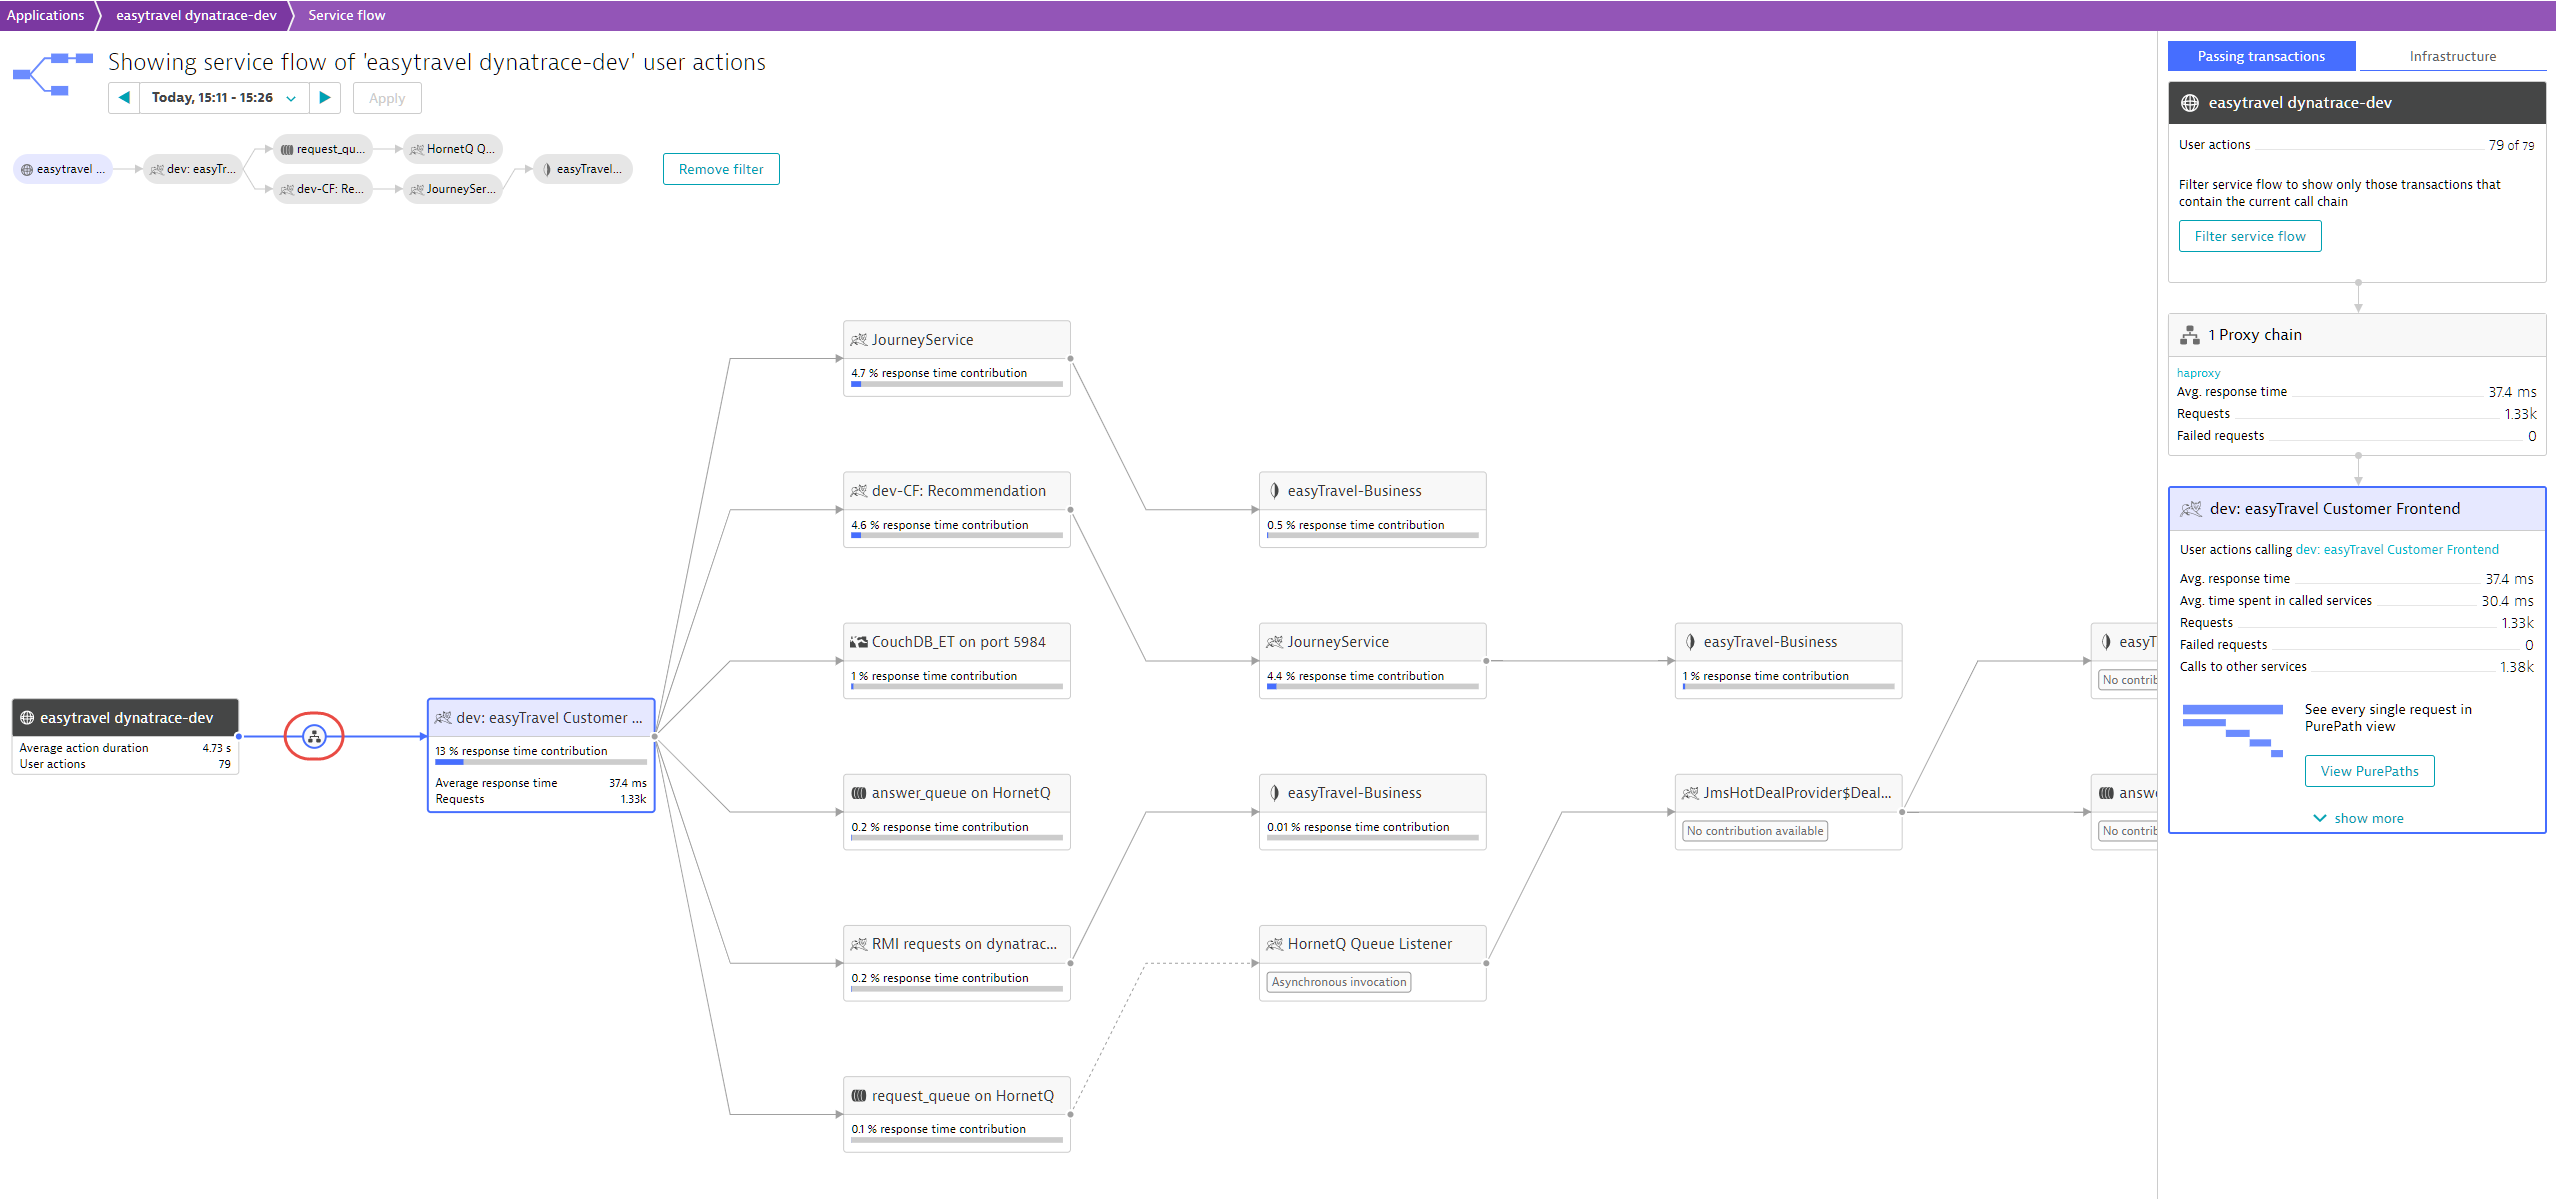
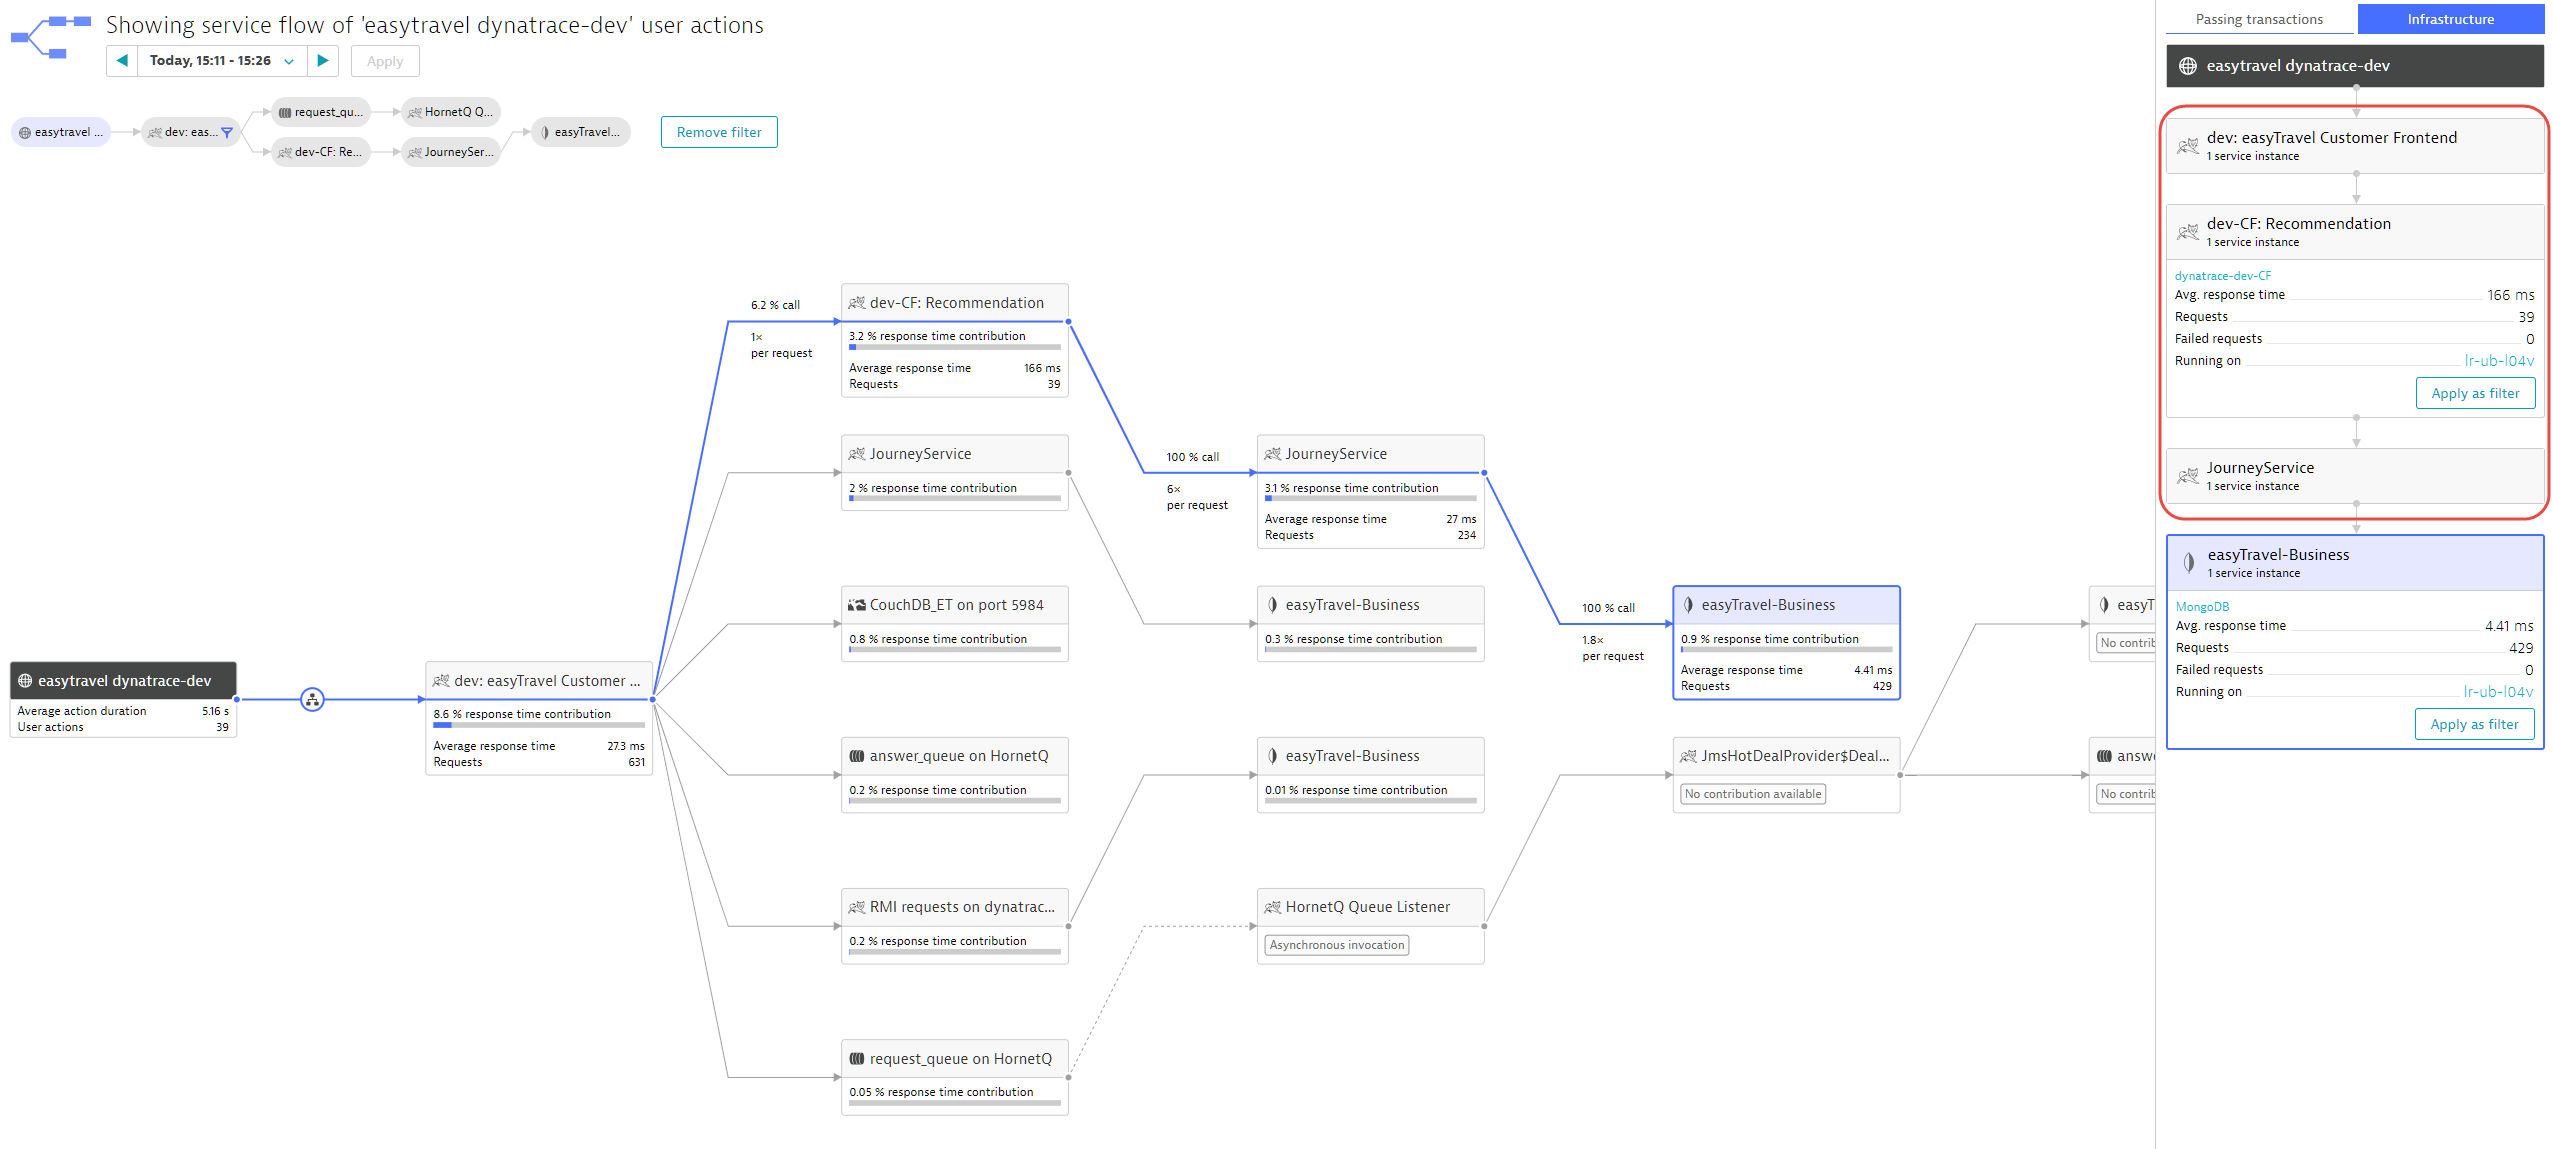
For some time now, Dynatrace has included load balancers and proxies on its service overview pages, within Service backtrace, and in other analysis views. This functionality is now also available in Service flow. As you can see in the example below, there is a load balancer depicted between the user’s browser and the easyTravel Customer Frontend. Clicking on it reveals that this is a HAproxy and how many of the depicted transactions pass through it in the current context. This can be tremendously important when analyzing performance issues.
Infrastructure
We’ve added a new Infrastructure tab to the details frame on the right side of the view (see below). For any selected node in Service flow, this tab tells you which processes and hosts were involved. More to the point, this tab shows you which processes participate in the transactions analyzed in Service flow.
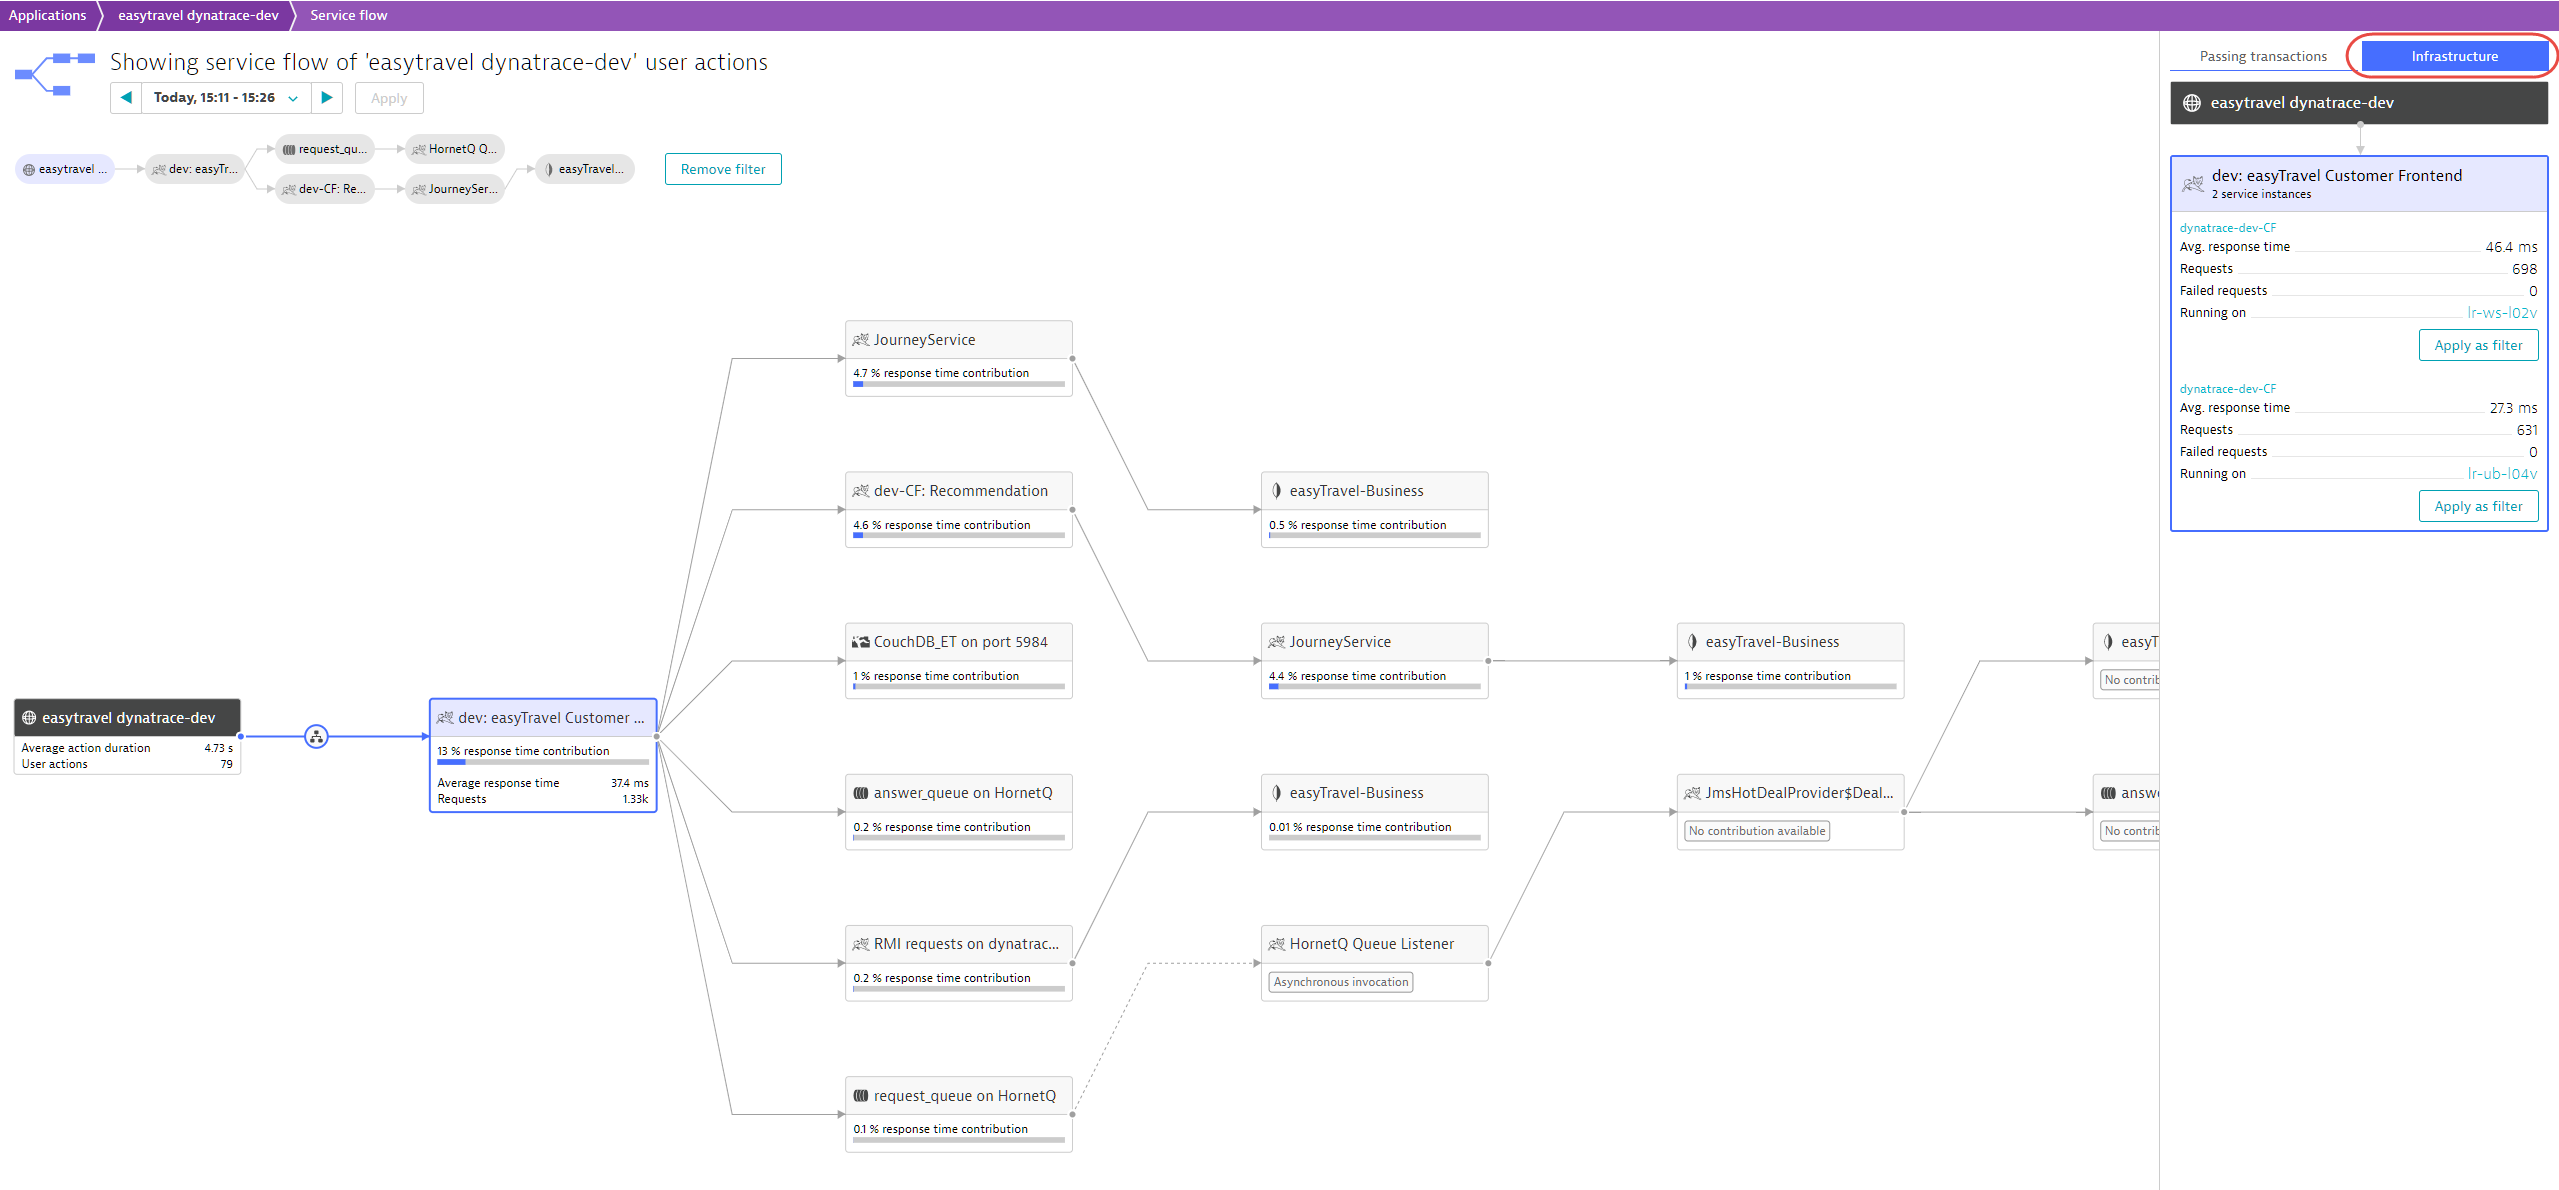
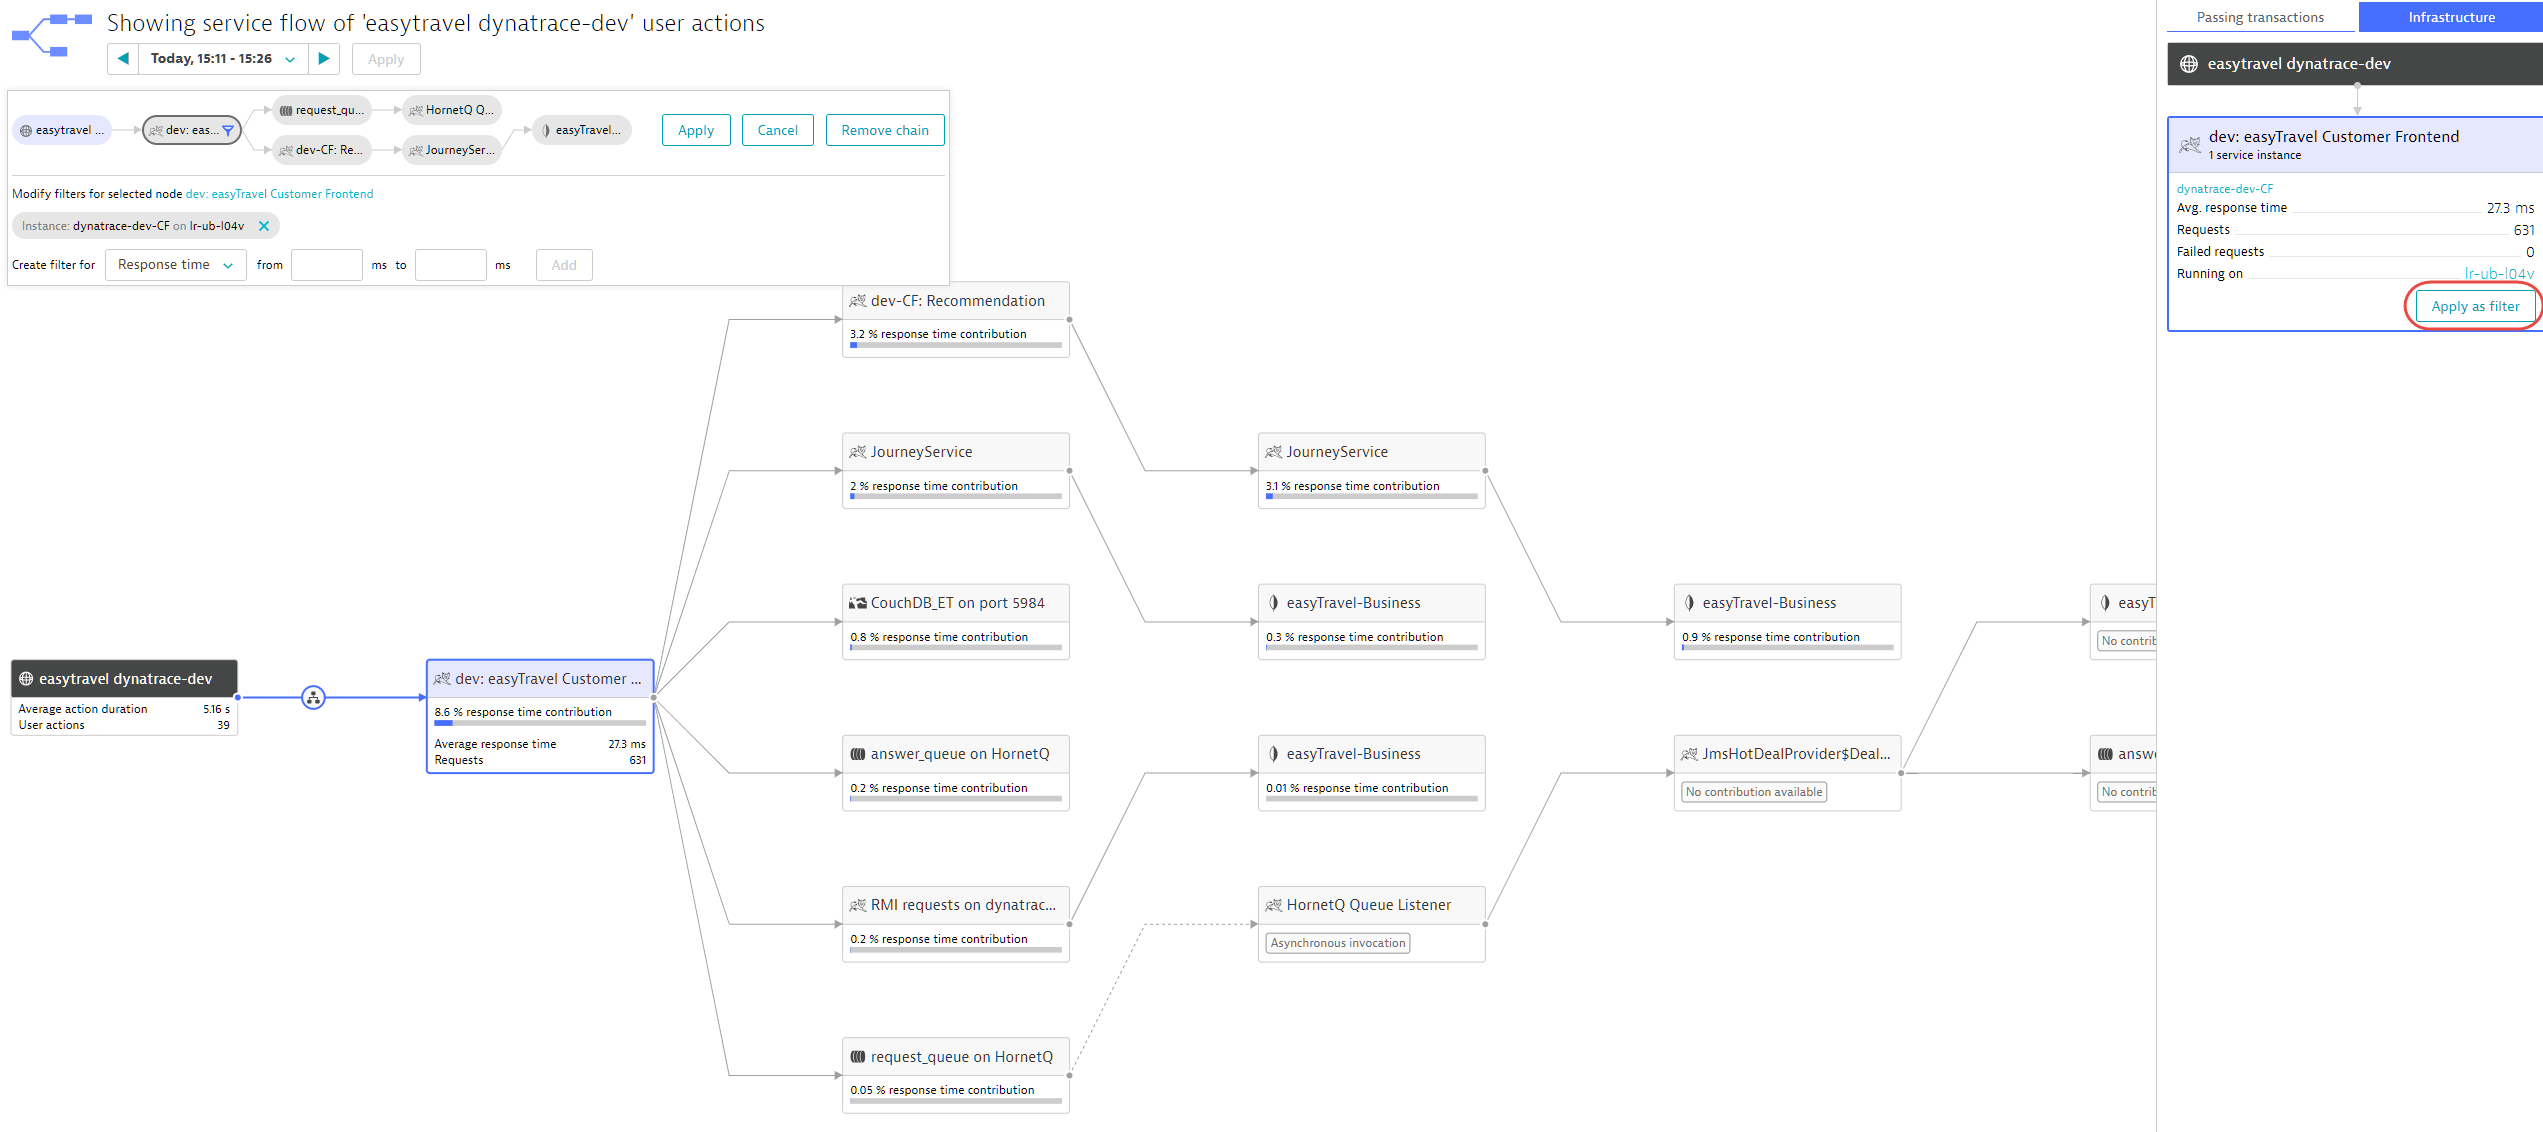
You can even filter Service flow to only display those transactions that pass through a particular process. To do this, click the Apply as filter button on the Infrastructure tab.
Again, this functionality works on any selected node within Service flow. For example, the example below shows that the selected MongoDB database runs on a particular host. You can also see that 3 Apache Tomcat services that are on the path to that MongoDB are included on the Infrastructure tab.
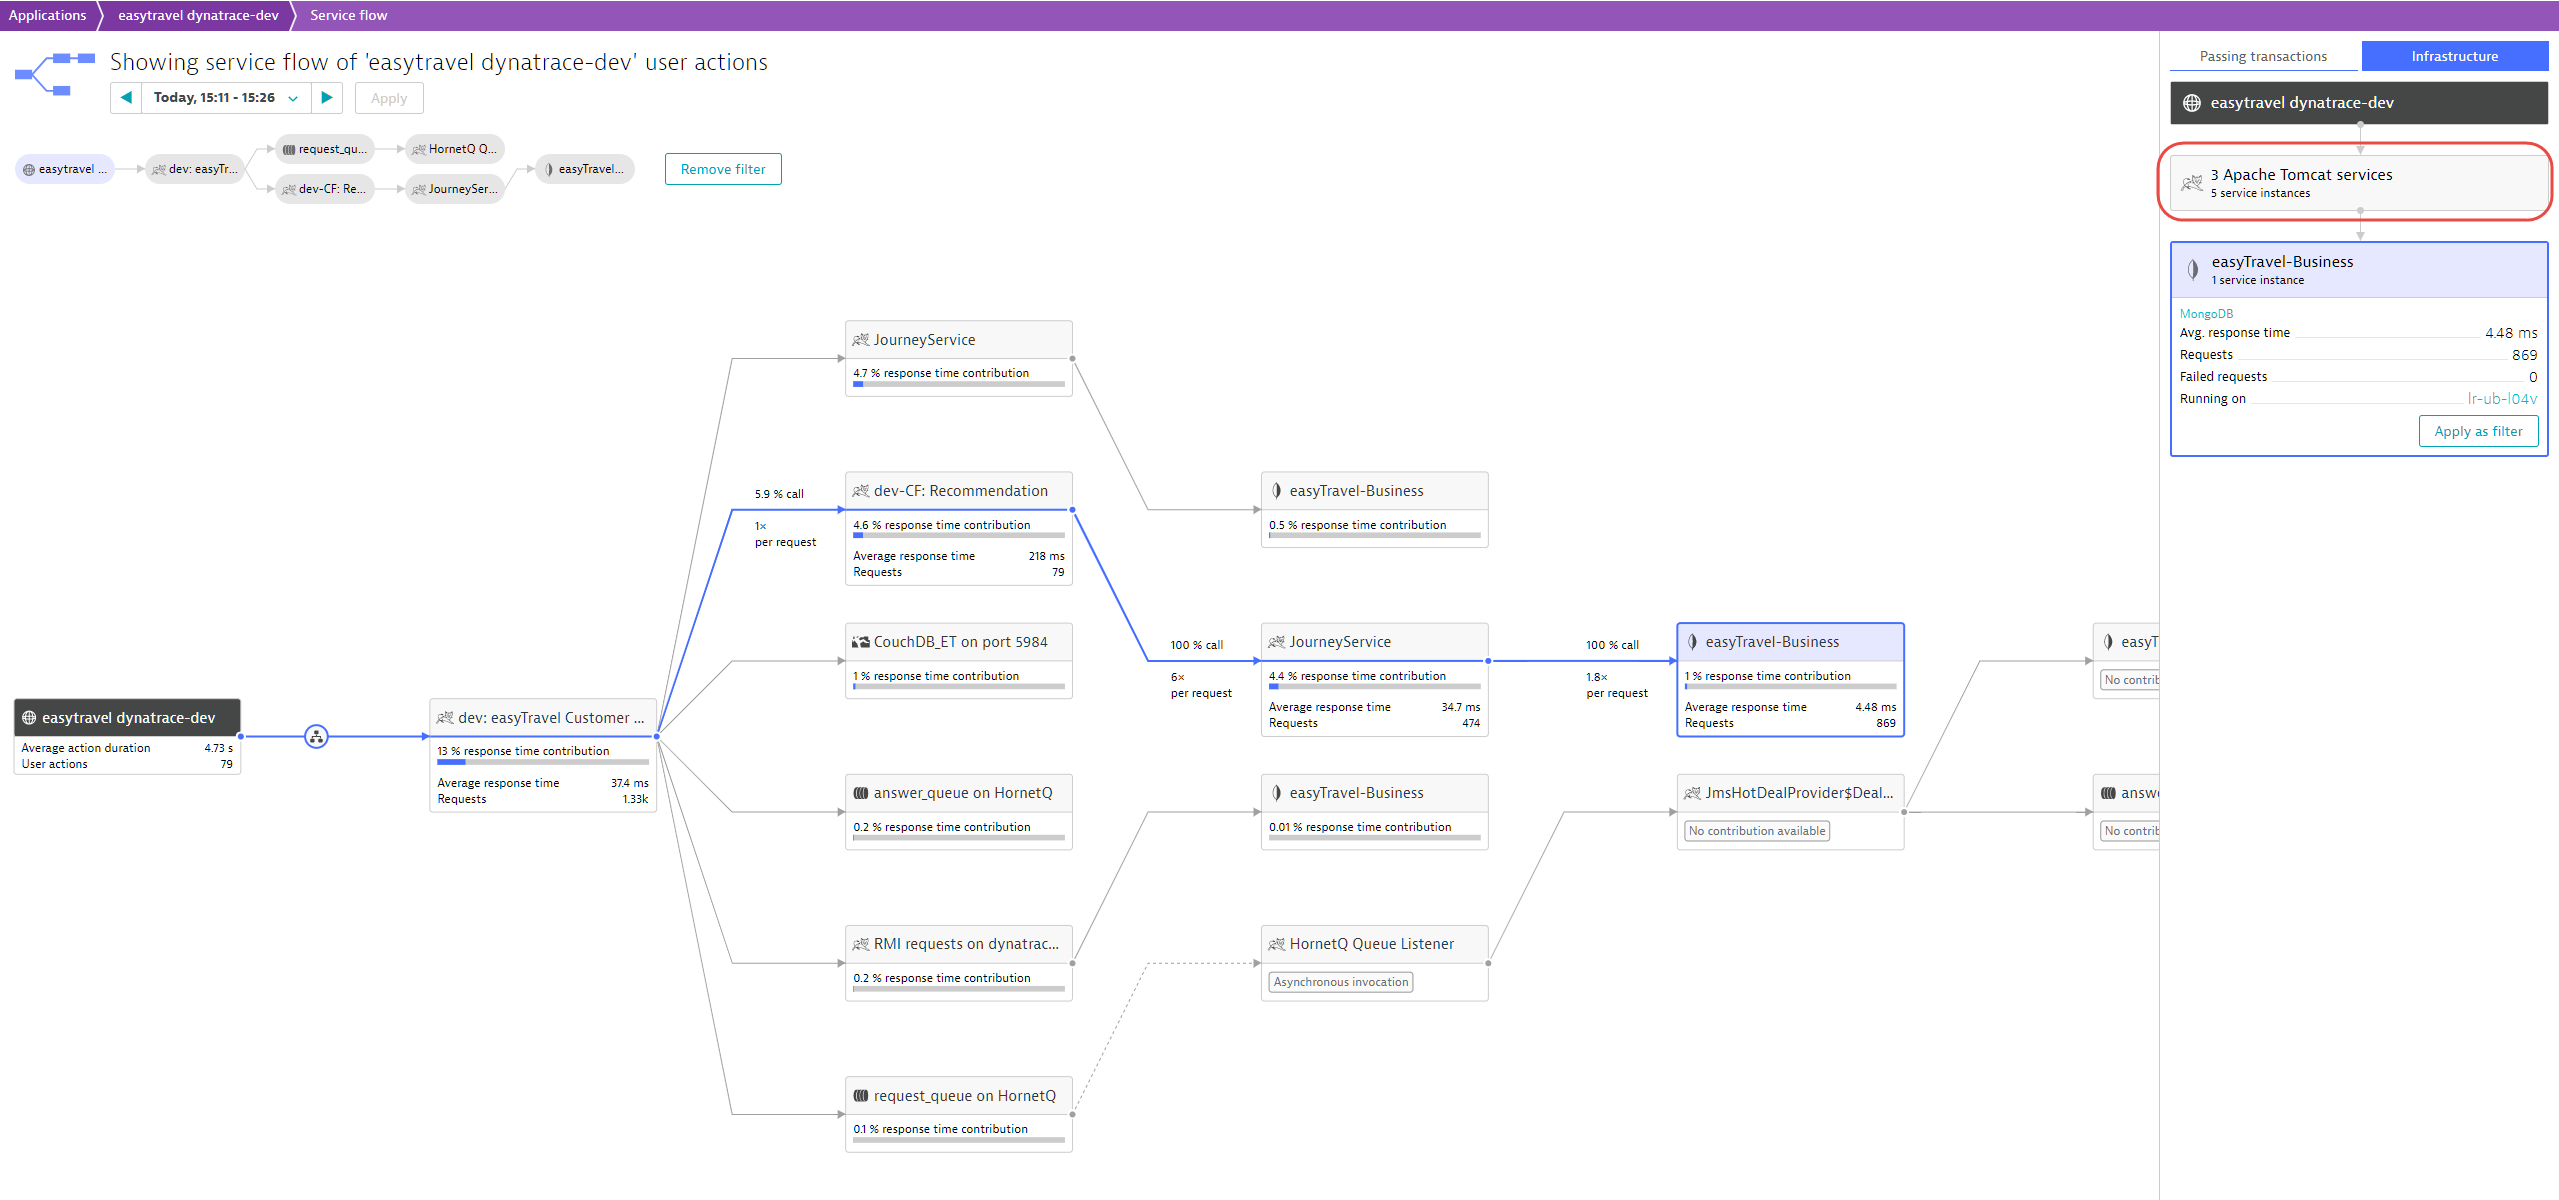
Clicking the consolidated Apache Tomcat services tile (see above) expands the service tiles so you can view them individually (see below).
With this expanded view (see above) we can now see exactly which processes and hosts were involved in this service flow and how many requests flowed through each of the Apache Tomcat services.
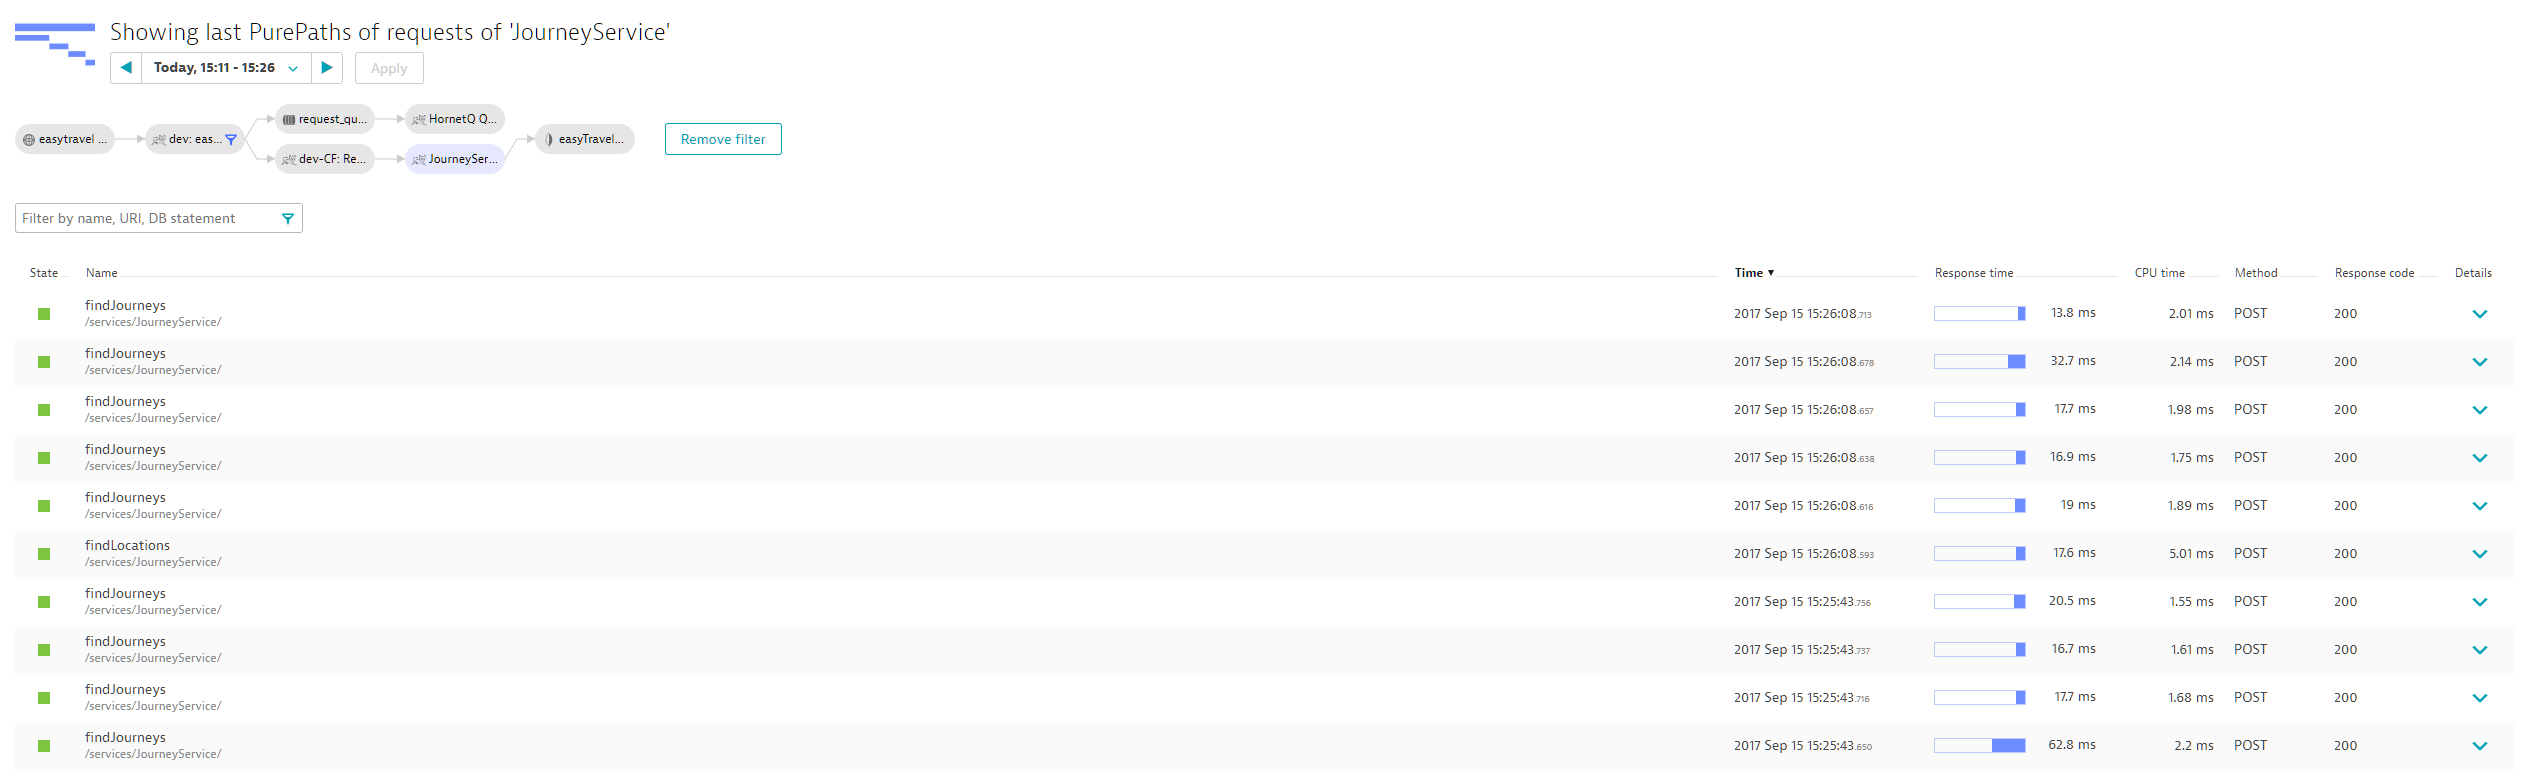
These enhancements make Service flow more powerful than ever and a great entry point for more detailed analysis, including analysis of individual PurePaths (see below).


Looking for answers?
Start a new discussion or ask for help in our Q&A forum.
Go to forum