
We’ve simplified the process for defining and managing custom-service monitoring in your environment. Custom services are application services that can’t be detected by Dynatrace out-of-the-box because they’re built on non-standard frameworks or technologies. With Dynatrace custom service detection, you can now define any method, class, or interface as the entry point of a service. Once configured, custom services are monitored alongside all the auto-detected services in your environment. The latest enhancement to custom service configuration includes a wizard that enables lookups at the method level.
The enhanced Custom service detection page now contains one tab page for Java services and a second tab page for .NET services. In the near future, this page will be extended to enable monitoring of custom services built on other technologies.
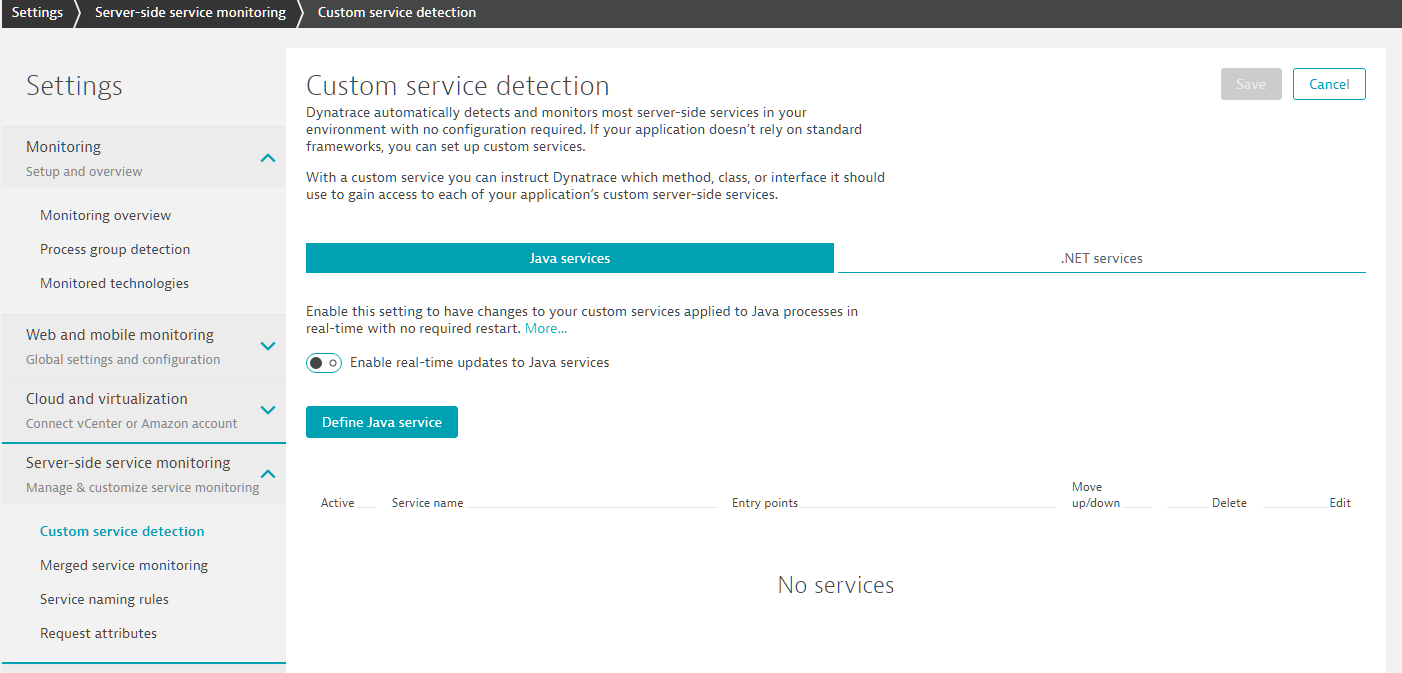
Java custom service detection example
To configure monitoring of a custom Java service
- Go to Settings > Server-side service monitoring > Custom service detection.
The Java services tab is selected by default. - Click Define Java service button.
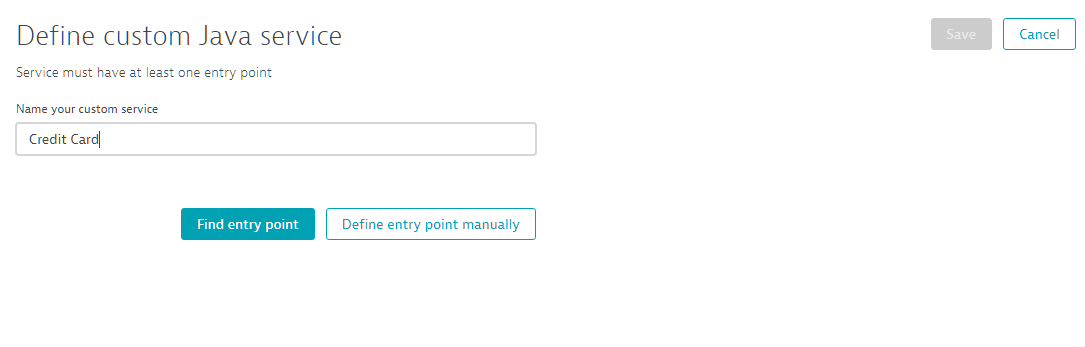
- Provide a Name for your custom service
- Click the Find entry point button.
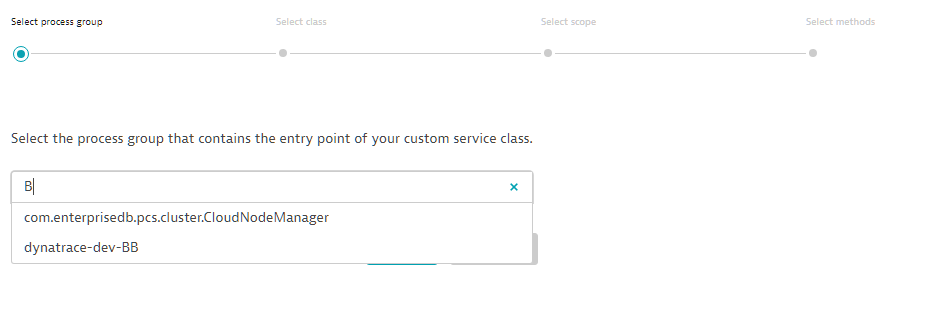
- Select the process group that contains the entry point of the custom service you want to monitor.
Begin typing in the Select the process group text field to filter the process group list.
- Search for the Java class.
Type in part of the class name and click the Search button to locate the class. Refine your search if the class you want isn’t listed.
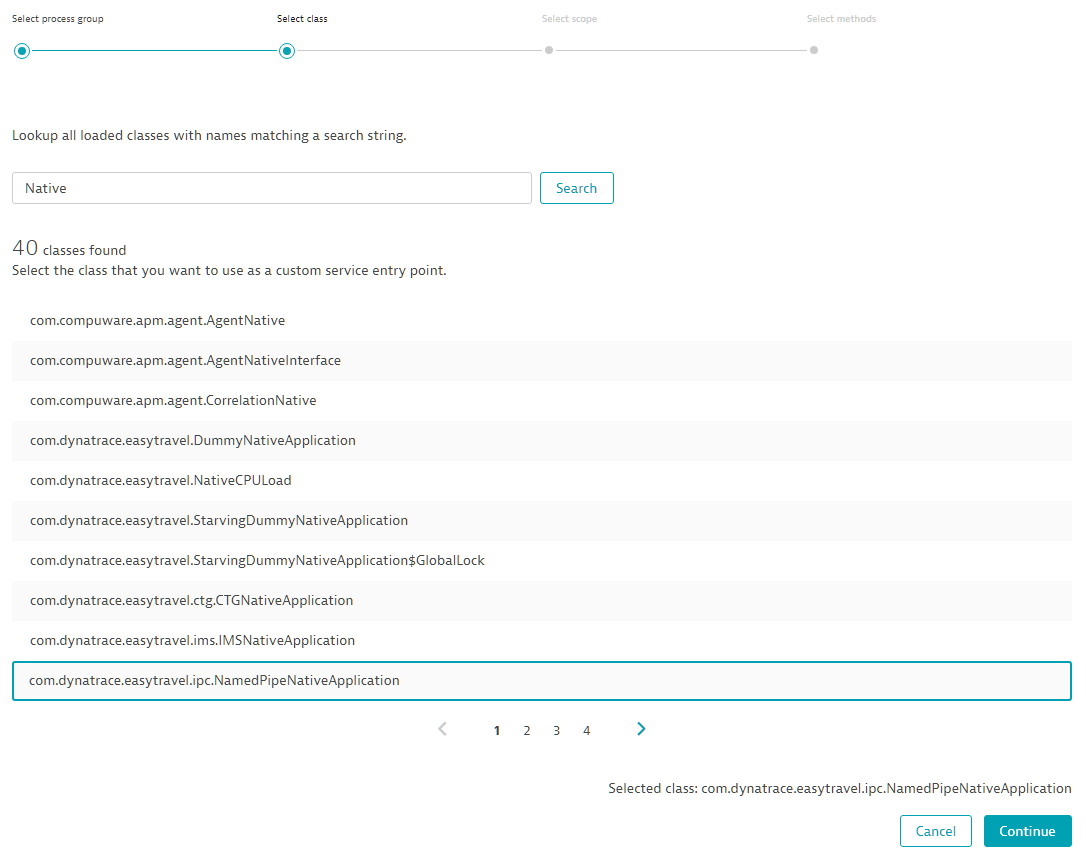
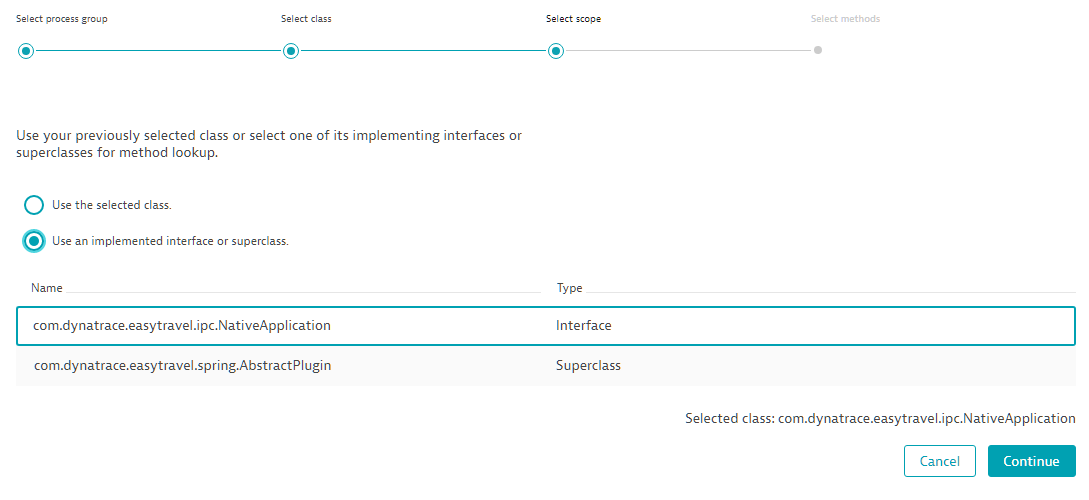
- (optional) If the selected class has super classes or an interface, select the Use an implemented interface or superclass option button to use one of these instead of the implementation you selected. Otherwise, select Use the selected class.
- Select the methods of the class that should act as entry points to the custom service. You can add more of these later if required.
- Click Finish to save the service’s entry point configuration.

- Click Save.

- Set the Enable real-time updates to Java services switch to the On position.
Your custom Java service will now be monitored by Dynatrace alongside all other auto-detected services in your application environment.
Benefits of custom service monitoring
With your custom application service now configured, it’s time to explore the valuable monitoring insights you gain with Dynatrace service monitoring. Run your application to generate some traffic for Dynatrace to monitor. Your custom service will be listed on the Services page (Settings > Transactions & services). Click the service name to view your custom services overview page (see example below).


Click the View all requests button to view the implementation of the service and all requests to it. Dynatrace uses artificial intelligence to automatically baseline performance and detect any issues with your services.
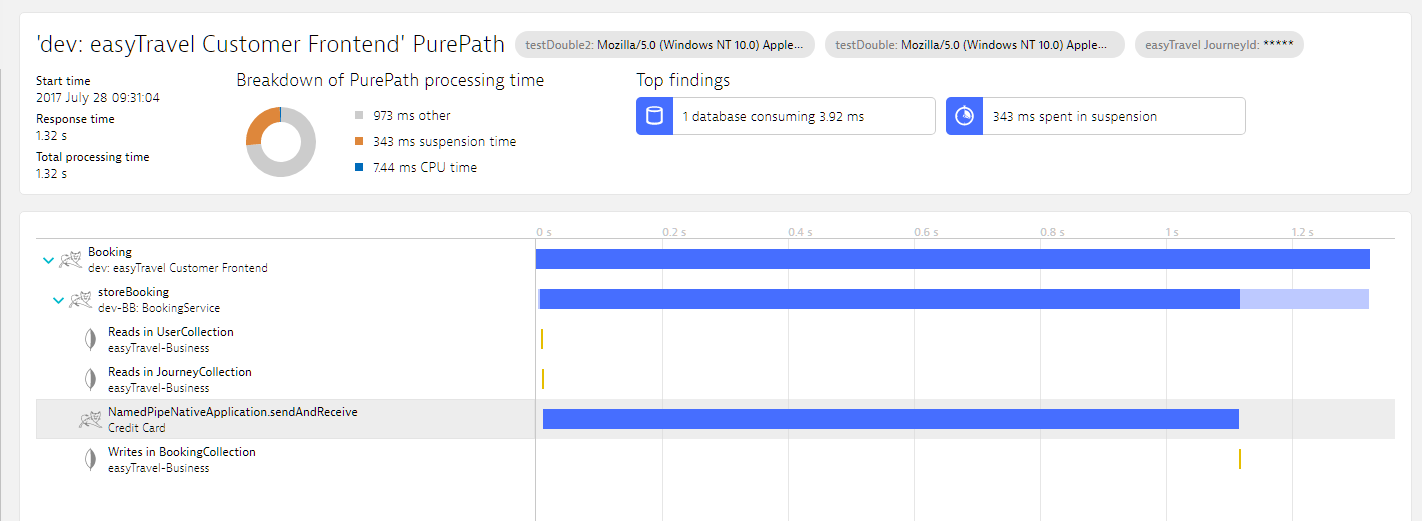
Because custom services are included in PurePaths, you can use PurePath analysis to see which other services call your custom service and understand how those requests affect the performance of your custom service.
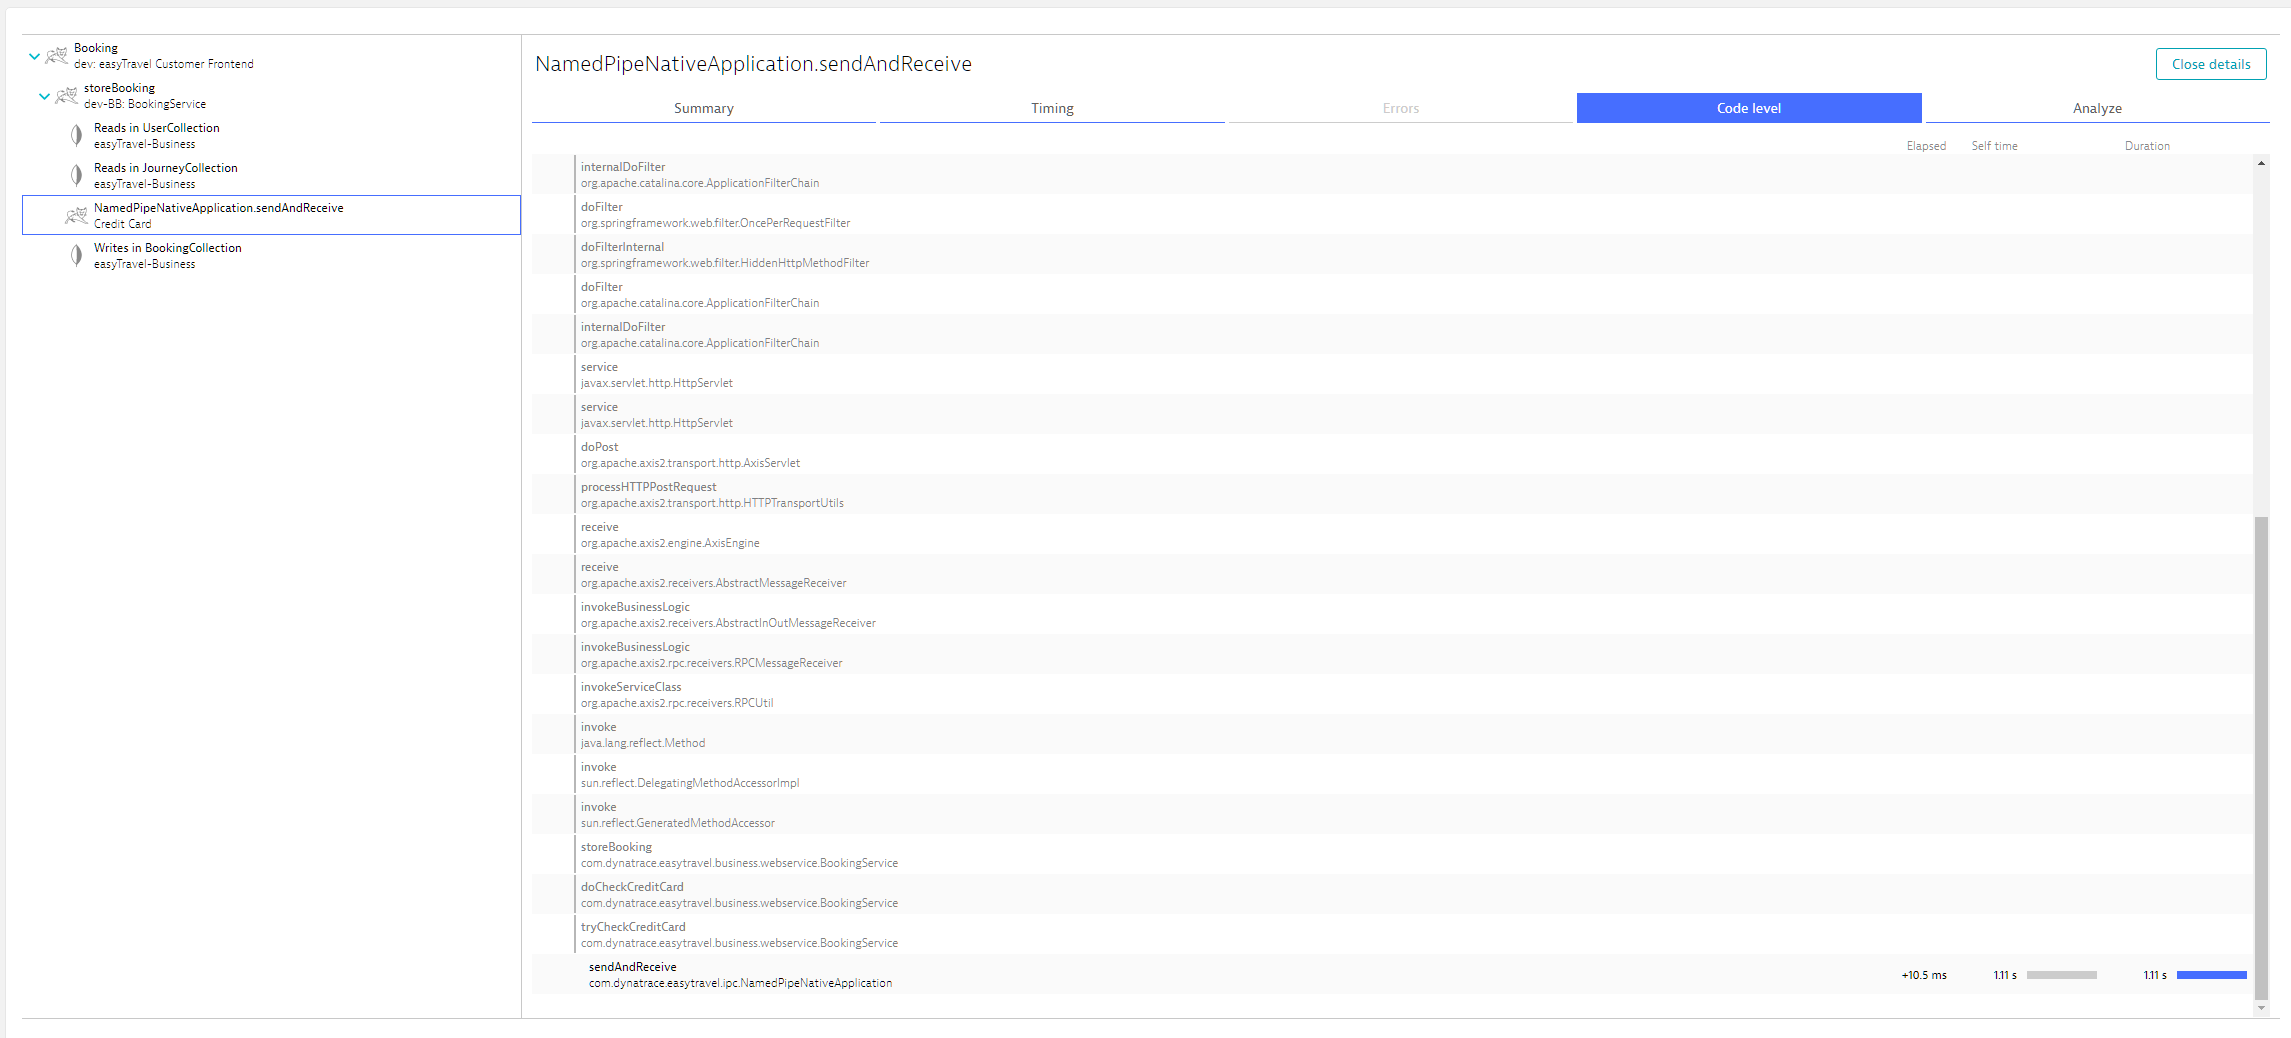
And of course, you can even get code-level insights into your custom service.
The same functionality outlined above is also available for custom services running in .NET processes. We’ll also extend this functionality in the future to support other technologies, so please stay tuned.
Limitation
While this enhanced custom service configuration works on earlier versions of Dynatrace OneAgent, the method lookup feature only works on OneAgent v125 and higher.


Looking for answers?
Start a new discussion or ask for help in our Q&A forum.
Go to forum