
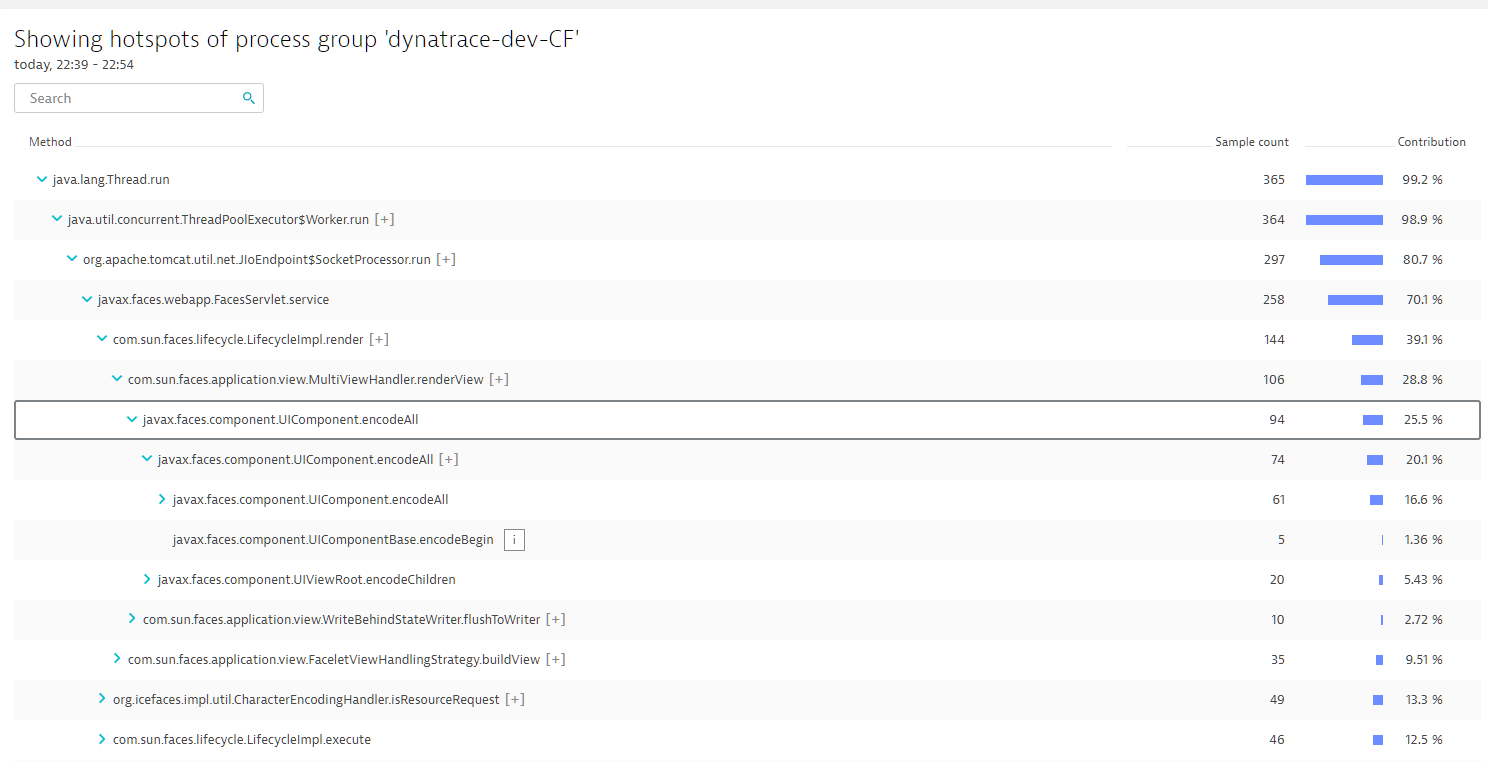
Dynatrace has long featured numerous capabilities for detecting and analyzing performance problems in your application environment. In addition to performance-analysis features related to services, we have other powerful tools, like the CPU Profiler which enables you not only to understand which are the biggest CPU consumers in your environment but also to drill down to the method level (Java or .NET) of any CPU problem. Dynatrace also automatically detects application crashes on Windows and Linux and analyzes the core dumps of these crashes. We’ve recently introduced memory-dump analysis support for all such crashes.
Diagnostic tools
To make it easier for you to access these great analysis views, we’ve consolidated them into a single page. Just select Diagnostic tools from the navigation menu to access them (note that this menu entry replaces the previous CPU profiler menu entry).
The Diagnostic tools page features the following analysis tools:
- CPU profiler
- Memory dump analysis
- Process crash analysis
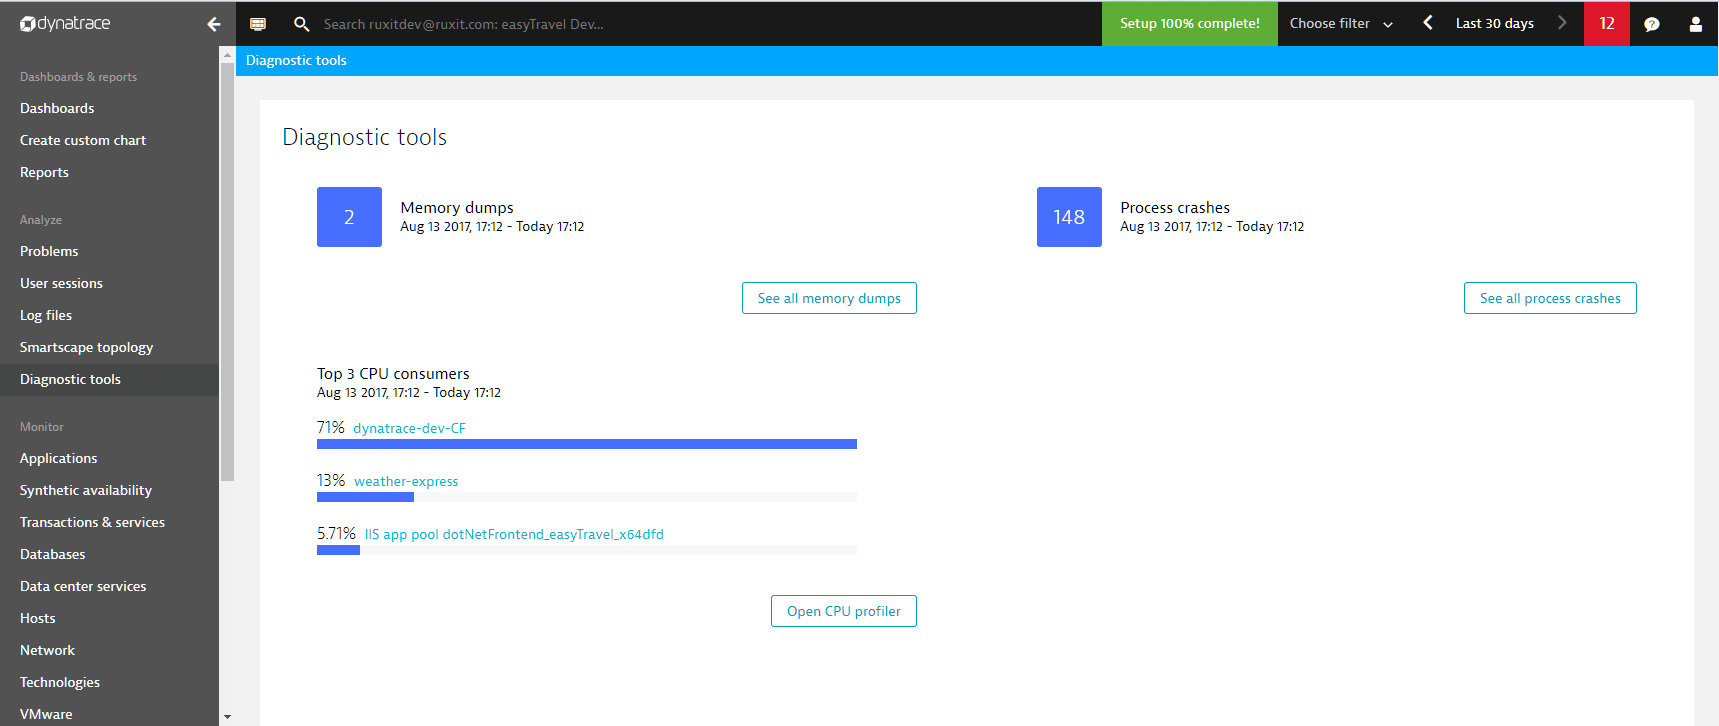
The Diagnostic tools page gives you quick and easy access to details of all the memory dumps and process crashes that were recorded in your environment during the selected analysis timeframe.
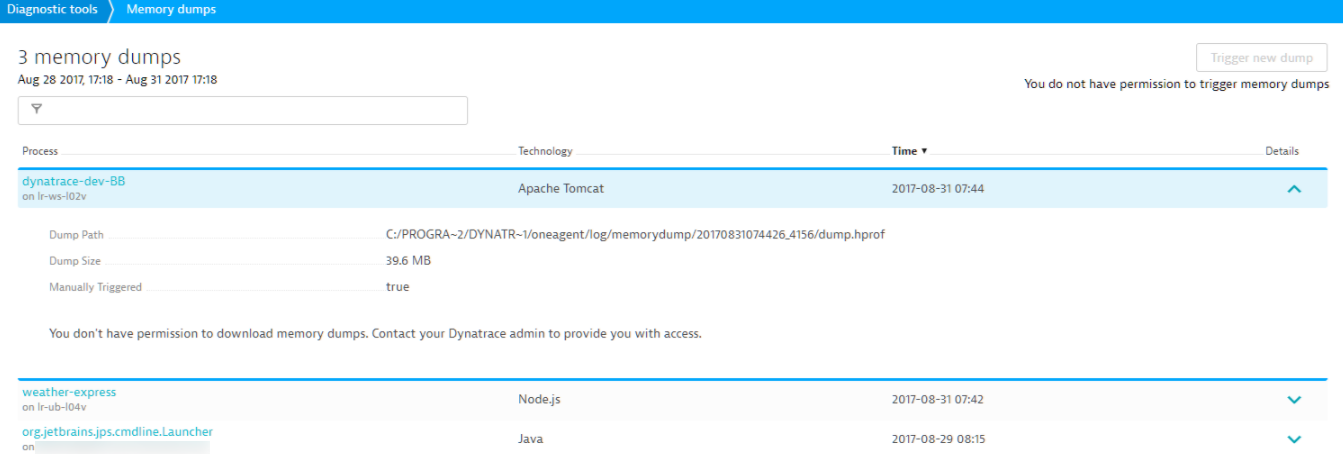
Memory dumps
Click the See all memory dumps button to access the Memory dumps page (see example below). Both this page and the Process crashes page support filtering to assist you in sifting through large numbers of dumps or crashes.
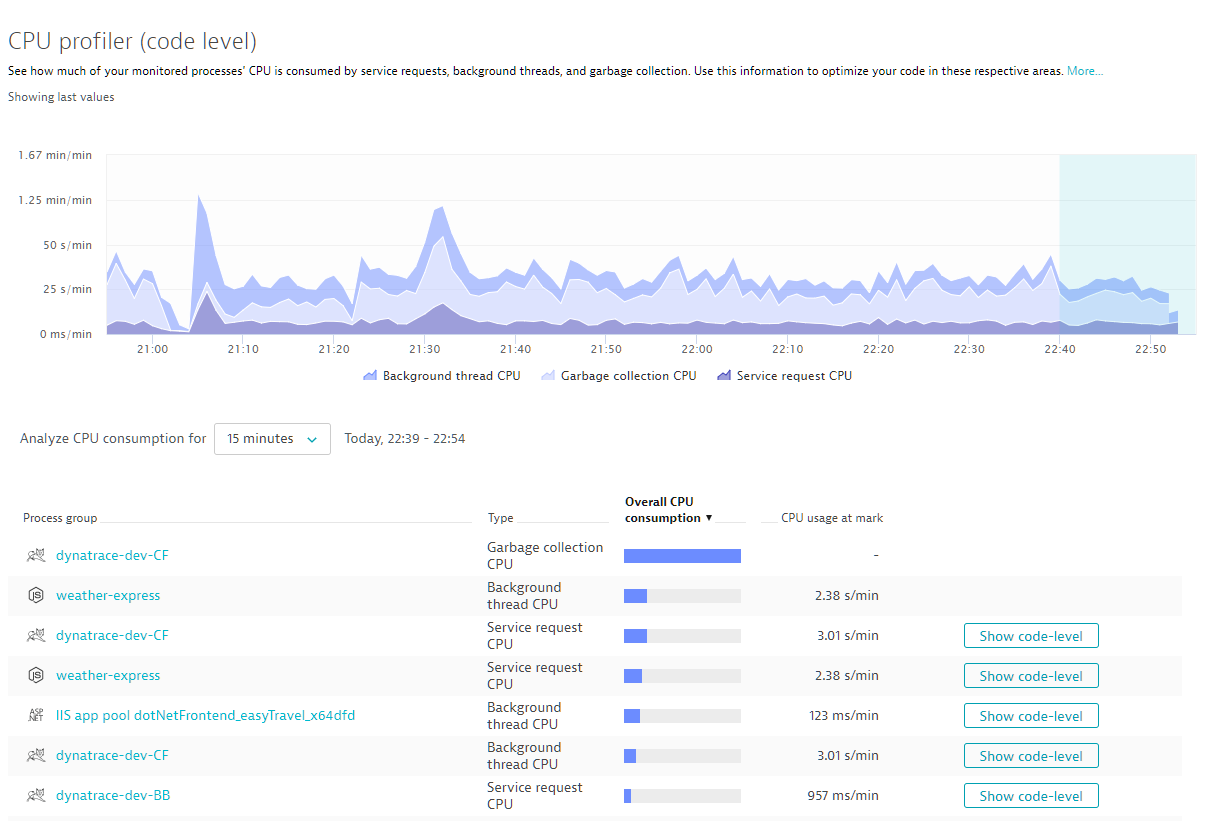
CPU profiler
Click the Open CPU profiler button to access the CPU profiler page and see which are the biggest CPU consumers in your environment.
What’s next?
Over the course of the next year or so, we’ll add additional diagnostics functionality. The Diagnostic tools page will continue to serve as a hub for these new diagnostic tools alongside our existing analysis features.


Looking for answers?
Start a new discussion or ask for help in our Q&A forum.
Go to forum