
Dynatrace recently released its annual Digital Experience Report comparing the digital experiences offered by leaders in seven industries. You can read the report to find out who the leaders are in your industry.
Beyond identifying the leaders, the report dives deep into performance analysis to give you some ideas on how to improve. In this post, I will highlight my top 5 tips for improving performance collected from the work my team does every day with Dynatrace customers.
1. ) Performance issues aren’t always technical
We’ve worked with thousands of sites, helping them drive performance management as a business goal, so we know that performance problems are not always technical problems. Often the issue is a lack of process and culture that is supportive of performance as a critical feature of customer experience.
I think we all know that performance is one of those features that’s invisible when everything is working well, but as soon as there’s a problem it becomes feature #1. Users get frustrated very, very quickly and that always impacts the business.
When there is a lack of visibility with performance issues, it can be a combination of inexperience in measurement and understanding the data and making it actionable. Additionally, there is often a lack of understanding of the budget for performance optimization initiatives.
One of the key questions on the path to a mature performance management strategy is how to weight performance optimization against business requirements and user expectations.
2.) Don’t neglect the basics of page construction
When we are out in the field we still see a surprising number of sites that are missing the fundamentals of performance management, while at the same time sites are becoming more complex. Problems we run across include:
- Overuse of JavaScript, CSS, and frameworks
- Endless scrolling causing delays to initial render
- Serialization of all types
- Missing the basics like persistent connections, cache control, large images sizes
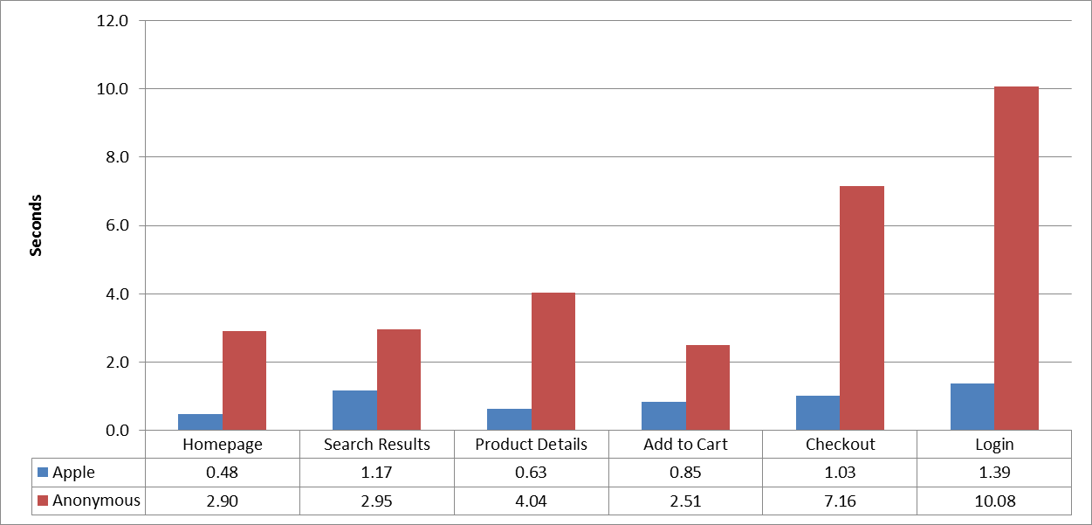
There is a massive discrepancy in performance of the Digital Experience leaders and the rest in this regard. For each step in the retail product order transaction, Apple (below in blue) is much faster than the poor performing site (in red).
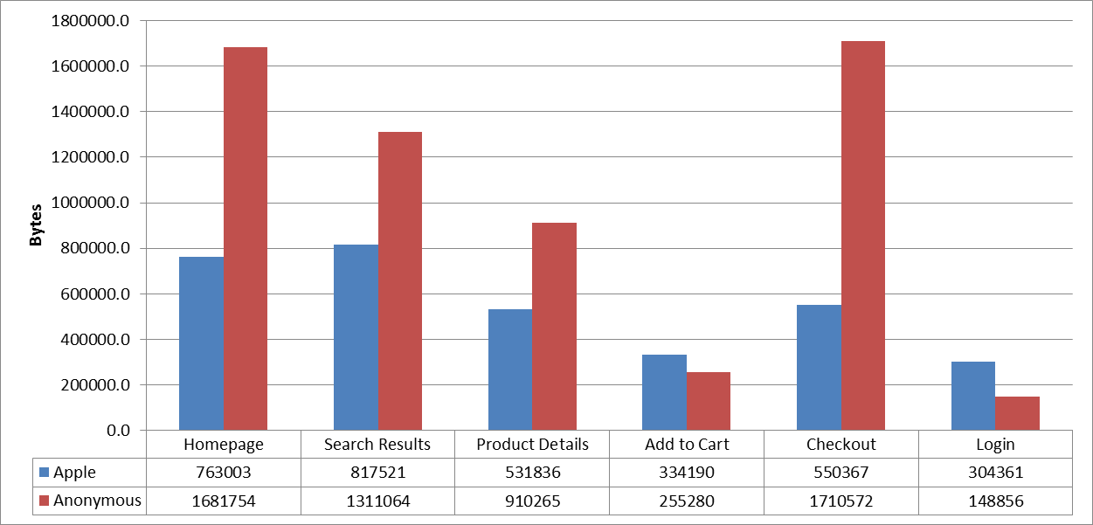
In the chart below you can see clearly that page construction is the cause of the slowdown for the poor performing site. The Apple site is less than a MB in size across all of the pages, with the homepage being the largest at about 760 KB. The other site is over a MB on most of the pages, and massively more complex.
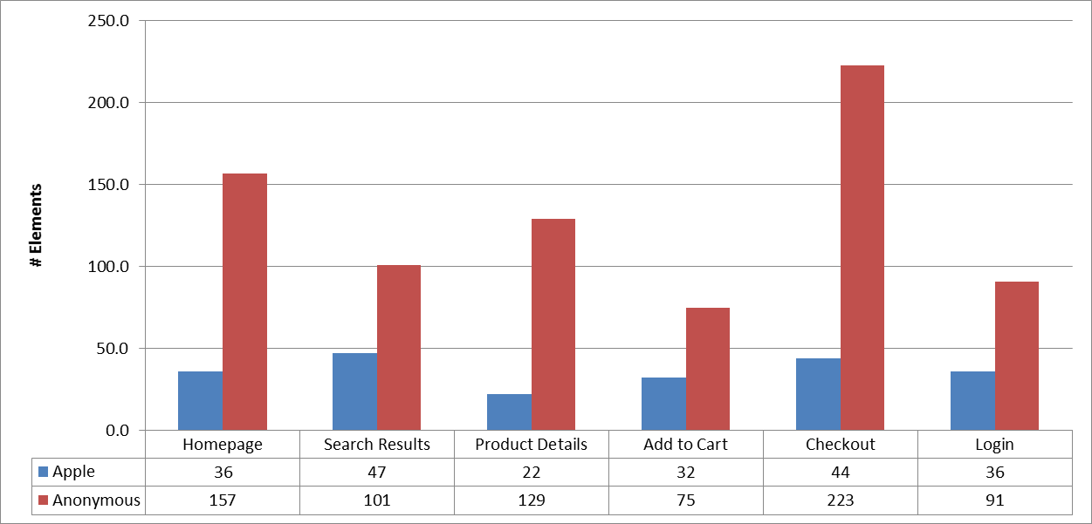
Element count is very important these days for high-bandwidth and mobile users. You can see below that the poor performing site has a far greater number of elements than Apple’s. The Homepage has 160 elements, Checkout has a whopping 200 requests and Login, despite being a very lean page size-wise, has a ton of requests, with 91 elements.
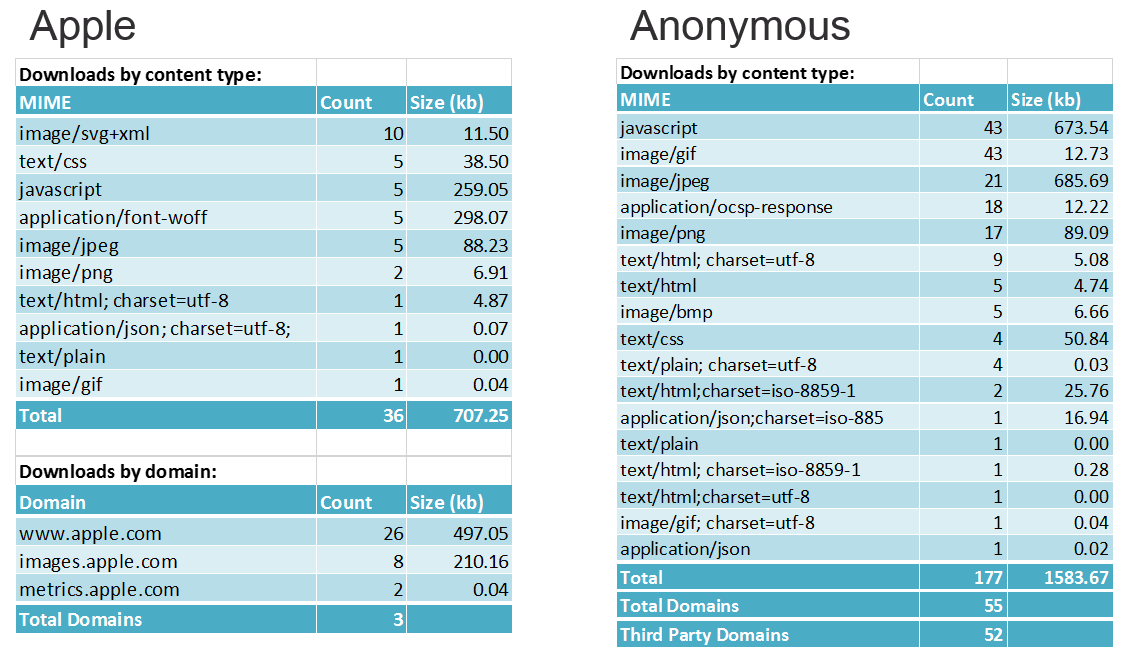
All of this has an effect on performance. When we looked at the more detailed analysis, we saw that the poor performing site has 43 JavaScript requests compared to Apple’s five. This has an effect not just on the network downloading those requests, but it also slows the user experience within the browser. For the poor performer, we also see many more image requests, html requests, etc.
3.) Make sure 3rd parties don’t become runaway train
One of the things that we’re working on very hard with many customers right now is knowing what 3rd parties are on the site: analytics, personalization, other web services, social, ad displays, tracking, etc.
In the comparison we started earlier, Apple is serving the entire site content from just three domains: its core domain which serves most of the content, the images sub-domain which serves the core image content, and the metrics domain which is collecting analytics data. On the poor performing site, we see many more domains, which is an indicator of overall complexity. It uses 55 domains with 52 of those are outside of the control of the site.
While there are many critical 3rd party services from ads to personalization, often 3rd parties become a runaway train that slows performance and damages the digital experience. You must know the value of each 3rd party to achieving business outcomes and overall customer experience, and determine whether the value each is delivering is worth the performance hit. It is critical that both the technical organizations and business organizations are involved in that assessment process and ongoing governance.
To manage 3rd party performance well you must:
- Focus on consistency.
- Look for load time under a hundred milliseconds; and move those that are not critical to render below the fold, ideally after onload (time to interactive page) to reduce the impact on core content.
- Audit their number and usage quarterly and make sure that they’re still needed. As campaigns roll off, we often see that tags get left in pages and they’re continuing to fire, but they’re not actually adding any value to the business or enriching the experience.
- Continuously compare how the performance of different vendors within each 3rd party service category stacks up.
4.) Responsive design shouldn’t mean slower mobile experience
I think it’s safe to say at this point that responsive design has mostly created a slower mobile experience for all of us. That’s not to say that it’s not a good thing, and certainly, that’s the direction that organizations are moving and with good reason. Responsive design creates a scenario where UI maintenance is easier because you have a unified code base, but it creates performance challenges—especially for mobile.
Within my team, we see a number of organizations that attempt to make responsive a bloated website built without best practices. The mobile site becomes almost unusable when it is re-launched, and then there’s the scramble to roll things back and fix performance.
There’s also this myth that because you have a mobile or responsive site you only need to measure one access method. Many customers think, “Well, it’s the same on all three portals. I’ll just measure with desktop,” and yet all three paradigms should be measured to make certain the experience is being gauged across all different devices.
We looked at the mobile home page of Apple and a poor performer from our study (below). They are both responsive sites and, looking at performance, you see a significant discrepancy. Apple is coming in at about 2.2 seconds with the other site coming in just over six seconds.

Then, when you look at the page construction (below), you can see why. The mobile environment features much higher latency connection dynamics where page construction matters much, much more.
We tell customers that, to optimize their responsive design, it is important to understand the massive variability of the mobile environment. It’s much greater than the standard backbone and last mile PC environments now. You’ve got 3G/4G/LTE/Tower connectivity to contend with.
You must measure across all three screens: desktop, mobile, and tablet but focus more specifically on the carrier network connections. Then, you need to expand the view of that data with real user data to have insight across all the different devices, operating systems, and browsers.
All of the issues that lead to a slower site on a desktop make a bigger impact on mobile:
- Overuse of JavaScript
- Too many custom font files and sizes
- Content serving that is not responsive for a mobile device – you probably don’t need that 1 MB JPEG
- 3rd parties that have no value for the mobile experience
- Etc…
5.) There is no single performance number to beat. Everything should be in context.
For a long time, the performance best practice was to try to get down to some universal number for every page response time. As this practice and the industry has become more sophisticated, we know that’s not right.
Customers become more patient the more invested in your digital experience they become. The longer they’re on the site, the more items they’ve added to the cart, then the more they’re willing to wait for a slow Login page or slow Checkout page.
There is some flexibility in where you focus your performance efforts and budget. Later in the funnel, you have more goodwill with your customers and more willingness to wait to get to the finish line than you do when they’re first coming to the site. When there are performance issues on the first couple of pages in a transaction, you’re going to see a much larger drop off.
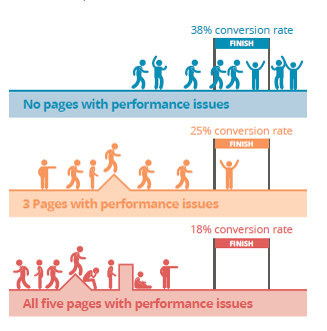
Customers are also more sensitive to performance based upon the number of pages they encounter with problems. A few months ago we did a study with T-Mobile to evaluate conversion rates across performance on real user data across hundreds of thousands of transactions.
In the below graphic, you can see that when there are no performance issues we saw an almost double conversion rate for users than we did when five pages in the transaction had performance issues. If there were three pages the conversion rate fell somewhere in between.
Efforts to improve your digital experience should be in the context of the needs of your customers and your business. I hope these 5 tips have given you some ideas on where to focus.
Learn more about our findings in the 2016 Dynatrace Digital Experience Report and find out who were the Best of the Web – read the report.


Looking for answers?
Start a new discussion or ask for help in our Q&A forum.
Go to forum