
This blog is not buzzword bingo. This is about implementing Shift-Left, Shift-Right and Self-Healing into a Continuous Delivery and Deployment Pipeline. To prove my point, I created a hands-on tutorial and uploaded it to this public GitHub Repo: https://github.com/Dynatrace/AWSDevOpsTutorial
There is also Performance Clinic Recording on our YouTube Channel.
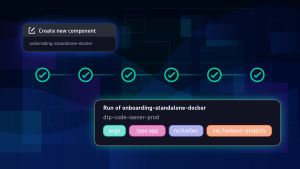
While I chose Dynatrace for Full-Stack Monitoring and AWS services for the pipeline, deployment, orchestration, compute and storage, you should be able to apply this to other cloud platforms and CI/CD tool chains. The following animation shows the delivery pipeline flow from “Pull Request” (left) until “Production Deployment” (right). Dynatrace plays the “Guardian” between Stages (Quality Gates) and orchestrates Self-Healing in Production:
What this tutorial shows is the role of Full-Stack Monitoring in modern Delivery Pipelines. Whether you use Dynatrace or other tools I believe the following use cases MUST BE supported to implement a pipeline that prevents bad code changes from impacting your real end users:
- Automated FullStack Monitoring: Ability to auto deploy and enable monitoring for your hosts, your PaaS (CloudFoundry, OpenShift, SAP Cloud Platform …) or your Functions (Lambda, Azure Functions …). Monitoring has to auto discover all processes, services and applications regardless of the technology stack used!
- Shift-Right: Ability to push deployment information and meta data to your monitoring environment, e.g: differentiate BLUE vs GREEN deployments, push build or revision number of deployment, notify about configuration changes …
- Shift-Left: Ability to pull data for specific entities (processes, services, applications, tests …) through an Automation API and feed it into the tools that are used to decide on whether to stop the pipeline or keep it running
- Self-Healing: Ability for smart auto-remediation that addresses the root cause (e.g: FIX a bad GC setting) of a problem and not the symptom (add more server because of high CPU caused by bad GC)
Let me briefly explain these 4 use cases in detail and how I showcase them in my Dynatrace AWS DevOps Tutorial you can walk through on GitHub:
Use Case #1: Automated Full-Stack Monitoring
Dynatrace’s OneAgent technology automates the tedious deployment of otherwise different monitoring agents (Java, .NET, Web Server, Node, Lambda, …) or even different monitoring tools (Network, Log, Container, Cloud) to achieve FullStack monitoring.
In my tutorial I auto deploy the Dynatrace OneAgent with the EC2 Instances launched through AWS CloudFormation by simply adding the download and installation script step to the UserData section of my EC2 Instance Definition. The following is a snippet from my CloudFormation template – you can see that the actual download URL is parameterized so that this script works for ANY Dynatrace Tenant:
"UserData": {
  "Fn::Base64": {
     "Fn::Join": ["", [
       "#!/bin/bash -xn",
       "# First: we download and install the Dynatrace OneAgentn",
       "yum update -yn",
       "yum install ruby wget -yn",
       "wget -O Dynatrace-OneAgent-Linux.sh "", {
         "Ref": "DynatraceOneAgentURL"
       }, ""n",
       "sudo /bin/sh Dynatrace-OneAgent-Linux.sh APP_LOG_CONTENT_ACCESS=1n",
       "# Second: ...",
Once these EC2 instances launch, Dynatrace automatically monitors them FullStack as shown in the following screenshot. A single agent gives you all of this visibility:
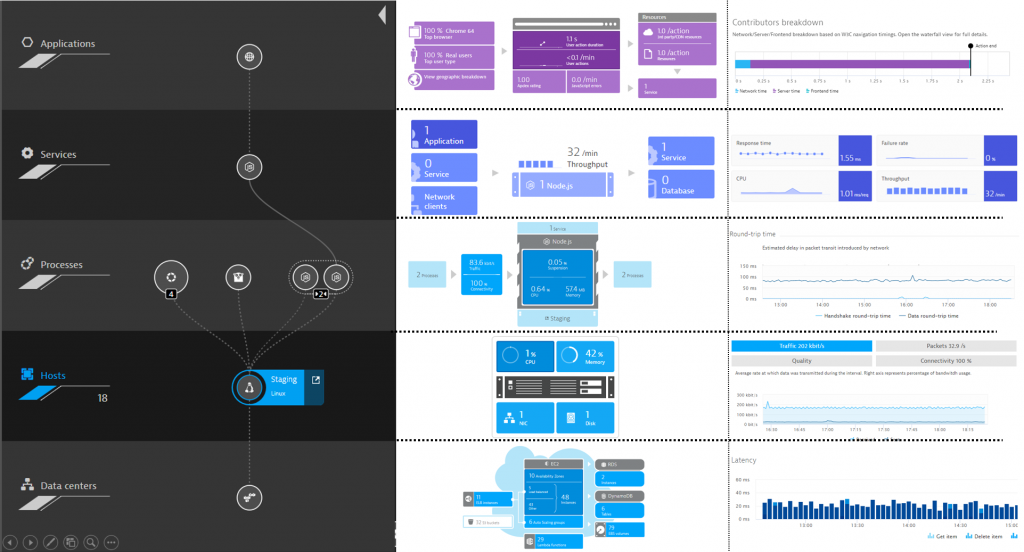
The screenshot above shows you Dynatrace Smartscape on the left, and some of the data automatically captured for each entity on the right. All this data is also accessible through the Dynatrace Smartscape API and Timeseries API.
Use Case #2: Shift-Right
Shift-Right for me means to push context information about deployments or changes to the environment that is monitored. The more context we have the better we detect root cause and the more effective we can implement Self-Healing.
Passing Meta Data (Tags, Properties, …) to Full-Stack Monitoring
The first implementation of Shift-Right is to pass meta data as part of your automated deployment process. By default, Dynatrace captures meta data such as tags from AWS EC2 instances, Docker, CloudFoundry, OpenShift, Kubernetes … – this eliminates the need to re-tag your entities in your monitoring tool. Simply re-use what you have already specified in your platform.
Additionally to automated meta data capturing from the underlying platform Dynatrace extracts more meta data from environment variables, Java properties, etc… In my tutorial, the shell script that AWS CodeDeploy executes when launching my application will export the environment variables DT_TAGS, DT_CUSTOM_PROP and DT_CLUSTER_ID. These are special environment variables that Dynatrace OneAgent automatically converts into meta data and tags on the Process Group Instances. If you have your own environment variables or Java properties that contain build specific information you can configure Dynatrace to pick these up through custom process group detection rules. The following screenshot shows what my AWS CodeDeploy script looks like:
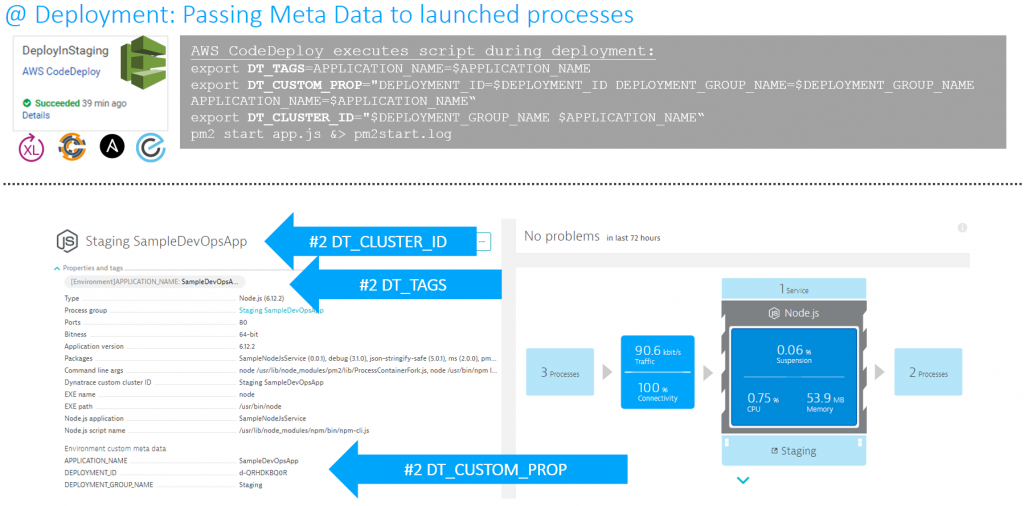
This is what I would call “Monitoring as Code” or “Monitoring as Configuration”. Why? Because monitoring data gets passed via your automated deployment configuration scripts! No need to configure these critical pieces of information twice! Simply RE-USE IT!
Passing Deployment Information to Full-Stack Monitoring
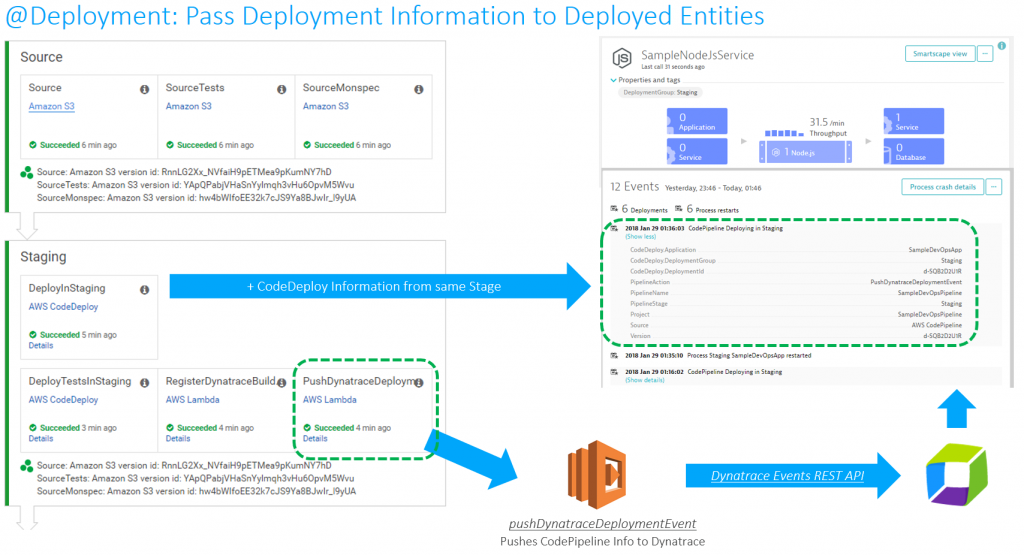
The second implementation of Shift-Right can be done via the Dynatrace API. The API provides the capability to push custom tags, timeseries or custom events to any monitored entity (host, process group instance, service or application). In my tutorial I used the Dynatrace Events API to push build and deployment information of the current AWS CodePipeline and AWS CodeDeploy run to the services that Dynatrace is monitoring:
Use Case #3: Shift-Left
The term Shift-Left has been used and probably abused just as often as DevOps. For me, Shift-Left means to use more data earlier in the lifecycle to answer the key question: “Is this a good or a bad change we try to push towards production?” And if it is bad, don’t push it further down the pipeline!
While monitoring data should not be the only data you look at in your pipeline (make sure you look at your code quality metrics) it is one aspect that many have tried to automatically include in the pipeline to automate build validation.
In my Dynatrace AWS DevOps Tutorial I use the Dynatrace Timeseries API to automate the Build Validation process by comparing different metrics for the services we push through the pipeline. We compare the current build that is pushed through with another baseline build or even with our current state in production. The following illustration shows how to define this type of comparison (Monitoring as Code), where to get the metrics from (which environments) and how to figure out whether this is a good or bad build (define thresholds):
Traditionally Build Validation is done manually by performance engineers that pull up different dashboards of different timeframes and either give their thumbs up or down. Many have automated the generation of these reports but still compare the final reports manually!
In my tutorial I completely automated this Build Validation Process! The Build Validation (=comparison) is triggered from the Pipeline and executed by an AWS Lambda Function which also approves or rejects the pipeline approval stage that allows or prevents it from entering the next stage. All build validation results and every single metric that was compared is also accessible through an HTML report I created:
The following animation shows how this is integrated into the Pipeline. A key aspect is that the Build Validation Process can only run when the load test has ran long enough to have enough data for a valid comparison. This “wait” is achieved through a validation request entered in a DynamoDB table and a period executing Lambda function that only executes that request when enough time has passed:
I have to give credit to Curtis Bray, who presented a similar concept at AWS re:Invent in his session called DevOps on AWS – Deep Dive on Advanced Continuous Delivery Techniques using AWS DevOps Tools. Thanks Curtis for the great inspiration!
Use Case #4: Self-Healing
No testing in the world guarantees for smooth sailing in production. Therefore, we must think about how to automate the situation if something goes wrong in production.
As you hopefully know, Dynatrace AI automatically detects problems in production and detects the root cause based on all the data captured through the FullStack monitoring approach provided by OneAgent. Every time a problem is detected, Dynatrace can notify external tools (ServiceNow, PagerDuty, xMatters, …) or call a webhook. In my tutorial I implemented an AWS Lambda function accessible through an API Gateway that can directly be called from Dynatrace in case of a problem. The Lambda function pulls additional information from Dynatrace about the problem, e.g: what was the latest deployment and when did it happen. If the latest deployment happened in close timely proximity to the detected root cause the Lambda function calls AWS CodeDeploy to deploy the previous revision that was deployed into the Production environment. A classical Rollback scenario:
I understand that deploying a previous revision is not the ultimate “self-healing” process. Depending on the actual root cause and the environment we must take different actions to “heal” the system. Check out my recent blog on Applying AI into our Digital Performance Life where I walk through 3 real life problems detected and what we would need to do to self-heal the system through something like a Lambda function or any other type of remediation script.
Your feedback is welcome
I hope some of you find the time to walk through my tutorial. Please give me feedback and let’s work together to define what an Unbreakable Pipeline must look like. Let’s make it so easy that nobody finds any excuses any longer to not do it! 😊


Looking for answers?
Start a new discussion or ask for help in our Q&A forum.
Go to forum