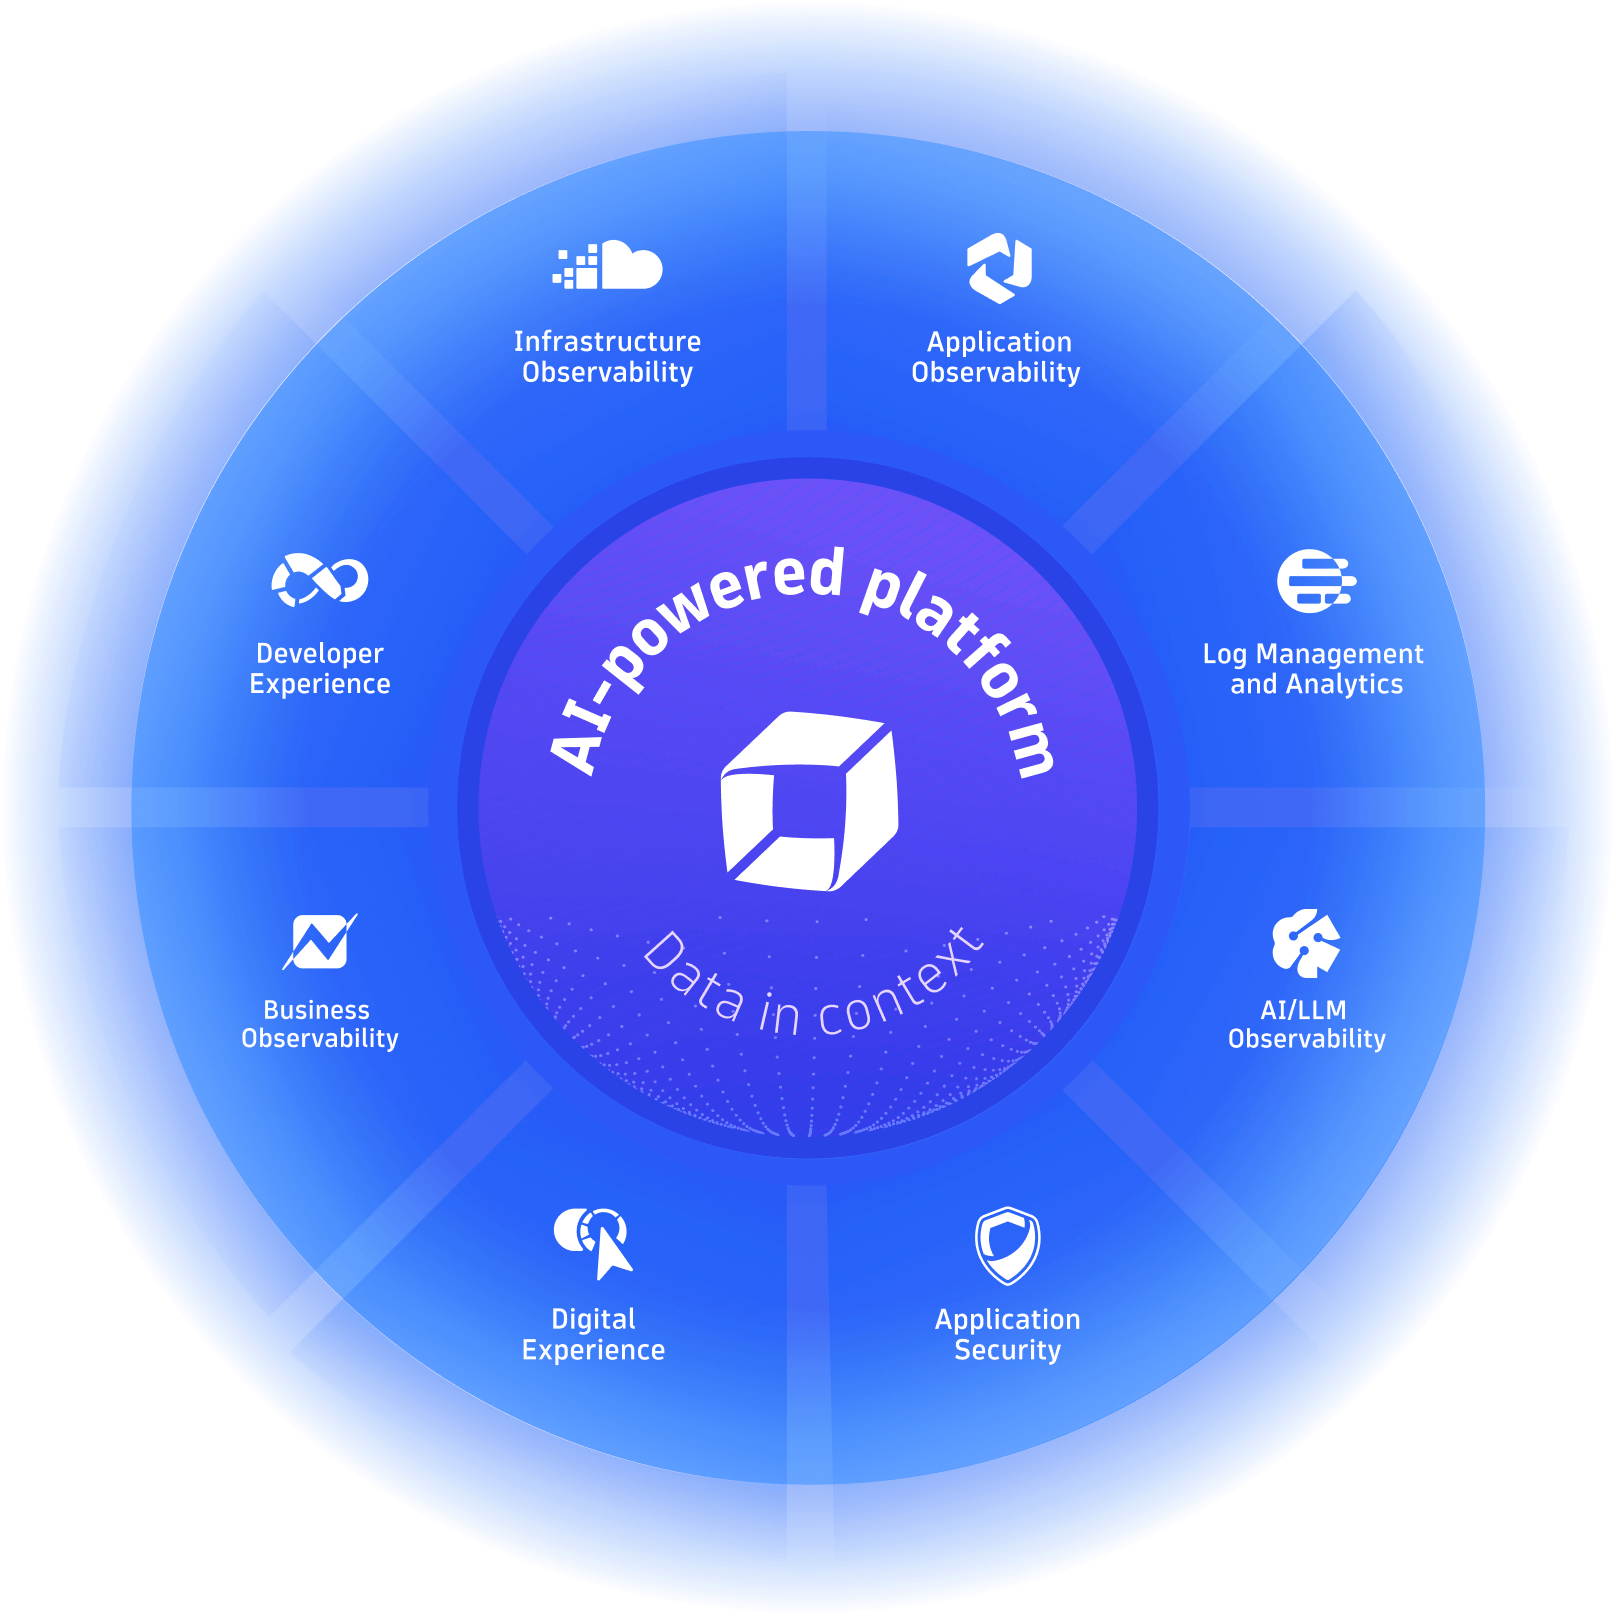
The Dynatrace platform
Tackle complex and dynamic workloads with agentic AI, fueled by unified data and real-time context - all in the industry’s most advanced AI-powered observability platform.
Different by design
Do amazing things with data
Integrate with every cloud, container, and technology you rely on — and build custom apps, automations, and AI agents to support all your business needs.
Innovate and collaborate with easy-to-build apps
Create and share custom apps that leverage insights from all your observability, security, and business data with AppEngine.

Drive agentic action with answers, not guesses
Orchestrate and fuel an ecosystem of built-in and third party agents with contextual data to prevent, remediate, and optimize with confidence.
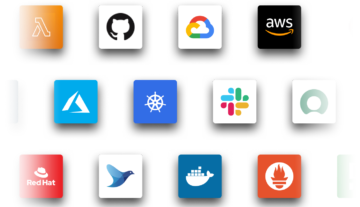
Get instant support for your clouds and technologies
Tap our expanding library of integrations, extensions, and apps, including technologies outside the traditional observability space.


Drive automation across the enterprise
Leverage AI, dynamic mapping, and our first-of-its-kind data lakehouse to bring all your data into context for instant analytics and automation.
Amplify your team with reliable, autonomous operations
Tackle dynamic AI workloads and enable AI-driven operations based on facts, not guesses, with Dynatrace Intelligence, the industry’s first agentic operations systems.

Visualize and understand your environment in real time
Automatically identify and map interactions and relationships between apps and the underlying infrastructure with Smartscape, and use that map to enrich and contextualize your data.

Securely unify and store all your data in context
Unify and contextually analyze your data with Grail™, the only causal data lakehouse with massively parallel processing (MPP).
Fast, indexless, schema-on-read storage
Ingest, store, and run lightning-fast analytics on observability, security, and business data with high performance and at scale.
All with enterprise-grade data privacy and security.

Turn all your data into a goldmine of insights
Automatically capture and pre-process data in any form, from anywhere, including open source data sets.
Ingest at scale, across any data type
All with simple, transparent pricing
Try it today for free
