The Dynatrace platform
Transform faster with analytics and automation for observability and security at scale.
All from the industry’s most powerful unified observability, security, and business platform.
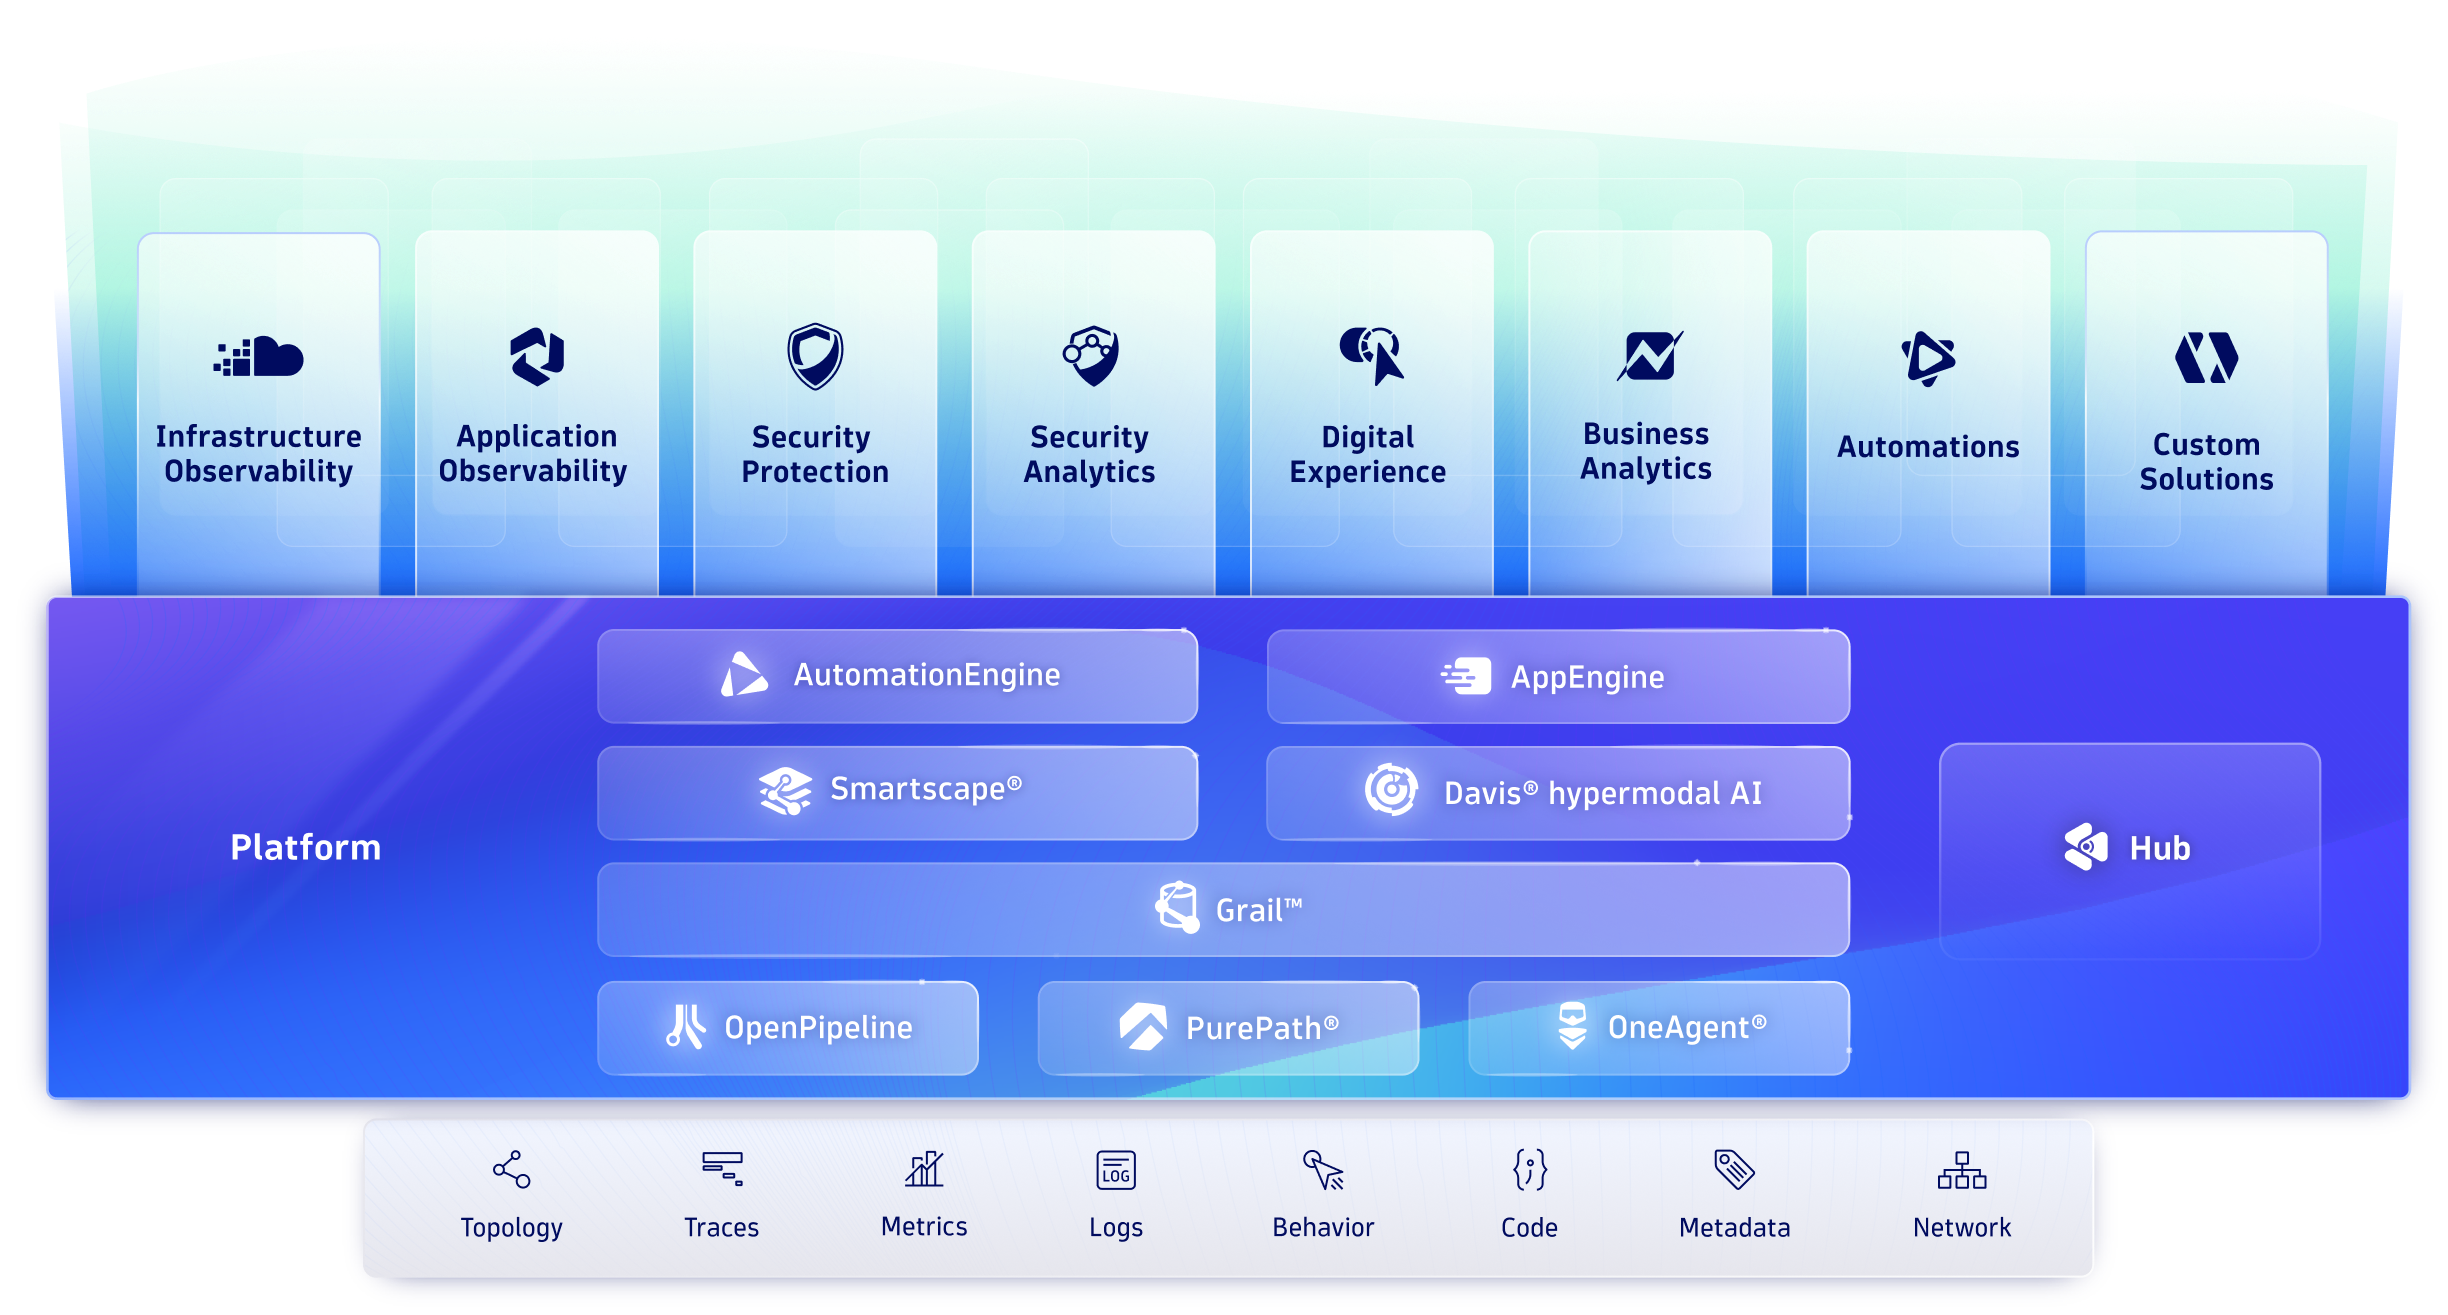
Different by design
Do amazing things with data
Integrate with every cloud, container, and technology you rely on, and build custom apps and automations to support all your business needs.
Innovate and collaborate with easy-to-build apps
Create and share custom apps that leverage insights from all your observability, security, and business data with AppEngine.
Automate custom BizDevSecOps workflows
Break down silos and turn data and answers into actions, securely and at scale, with AutomationEngine.
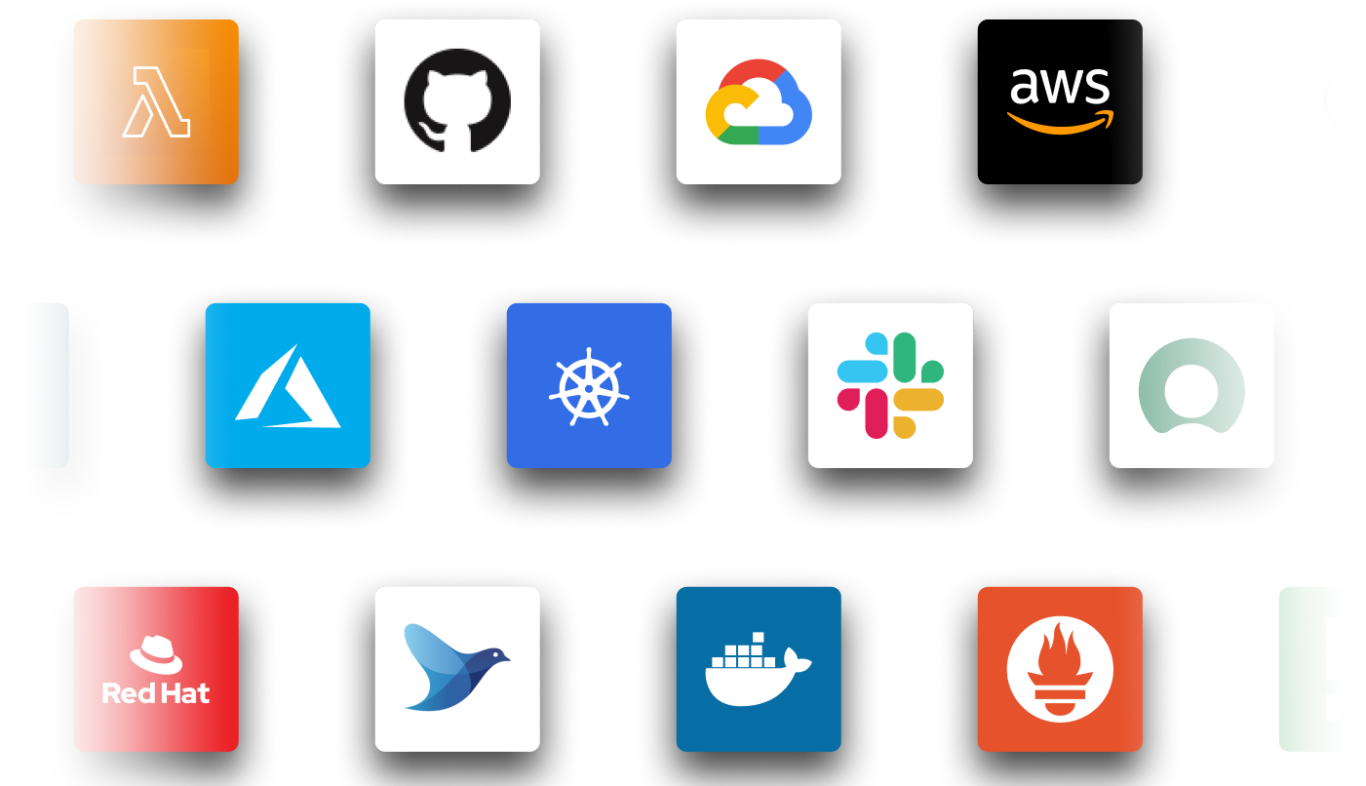
Get instant support for your clouds and technologies
Tap our expanding library of integrations, extensions, and apps, including technologies outside the traditional observability space.


Automate anything you want
Leverage AI, dynamic mapping, and our first-of-its-kind data lakehouse to bring all your data into context for instant analytics and automation.
Visualize and understand your environment in real time
Automatically identify and map interactions and relationships between apps and the underlying infrastructure with Smartscape, and use that map to enrich and contextualize your data.

Supercharge productivity with hypermodal AI
Davis®, our revolutionary AI at the heart of the platform, combines predictive, causal, and generative AI to deliver precise answers, intelligent automation, and recommendations, and predict issues before they impact customers.
-
Forecast
-
Determine
-
Create
Predictive AI

Causal AI

Generative AI

Securely unify and store all your data in context
Unify and contextually analyze your data with Grail™, the only causal data lakehouse with massively parallel processing (MPP).


Turn all your data into a goldmine of insights
Automatically capture and pre-process data in any form, from anywhere, including open source data sets.
Ingest at scale, across any data type
All with simple, transparent pricing
Try it today for free
