Gänzlich neue Einblicke in Ihr Unternehmen
Mit dem führenden Anbieter von KI-gestützter Observability wird Komplexität zu Ihrem größten Wettbewerbsvorteil.

Im Gartner® Magic Quadrant™ für Observability-Plattformen 2025 als Branchenführer ausgezeichnet
Lesen Sie im kostenfreien Report, warum Gartner uns im aktuellen Magic Quadrant in Bezug auf die „Ability to execute“ die Höchstbewertung gegeben hat.
This graphic was published by Gartner, Inc. as part of a larger research document and should be evaluated in the context of the entire document. The Gartner document is available upon request from Dynatrace. Dynatrace was recognized as Compuware from 2010-2014.


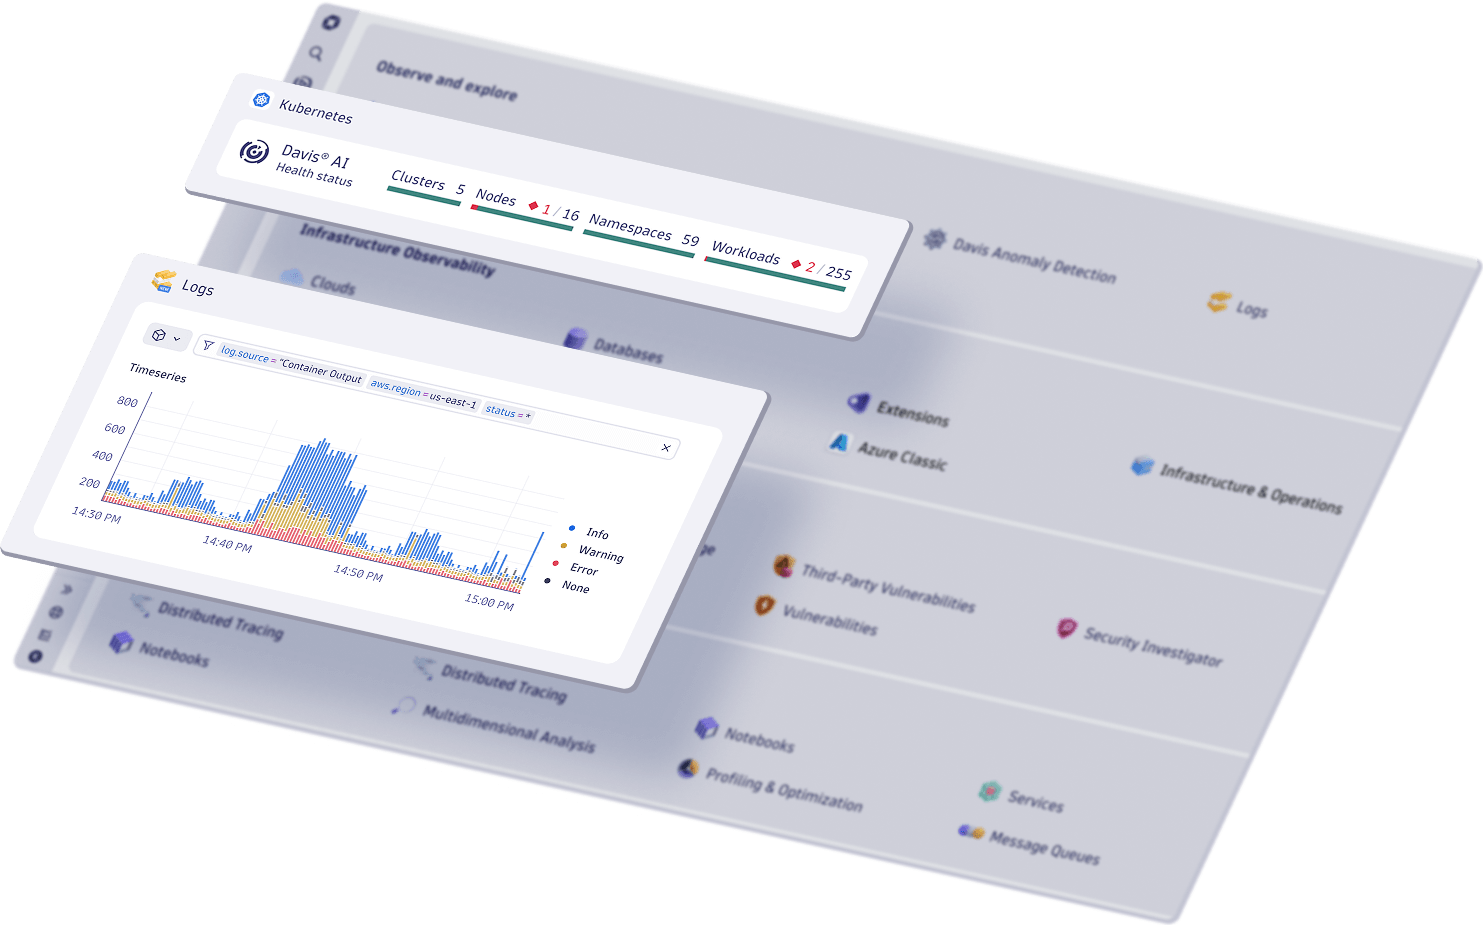
Schneller automatisieren, analysieren und Innovationen umsetzen mit KI
Gewinnen Sie mit der einheitlichen Observability- und Sicherheitsplattform und leistungsfähiger KI genaue Einblicke in Ihre Systeme und Daten.
-
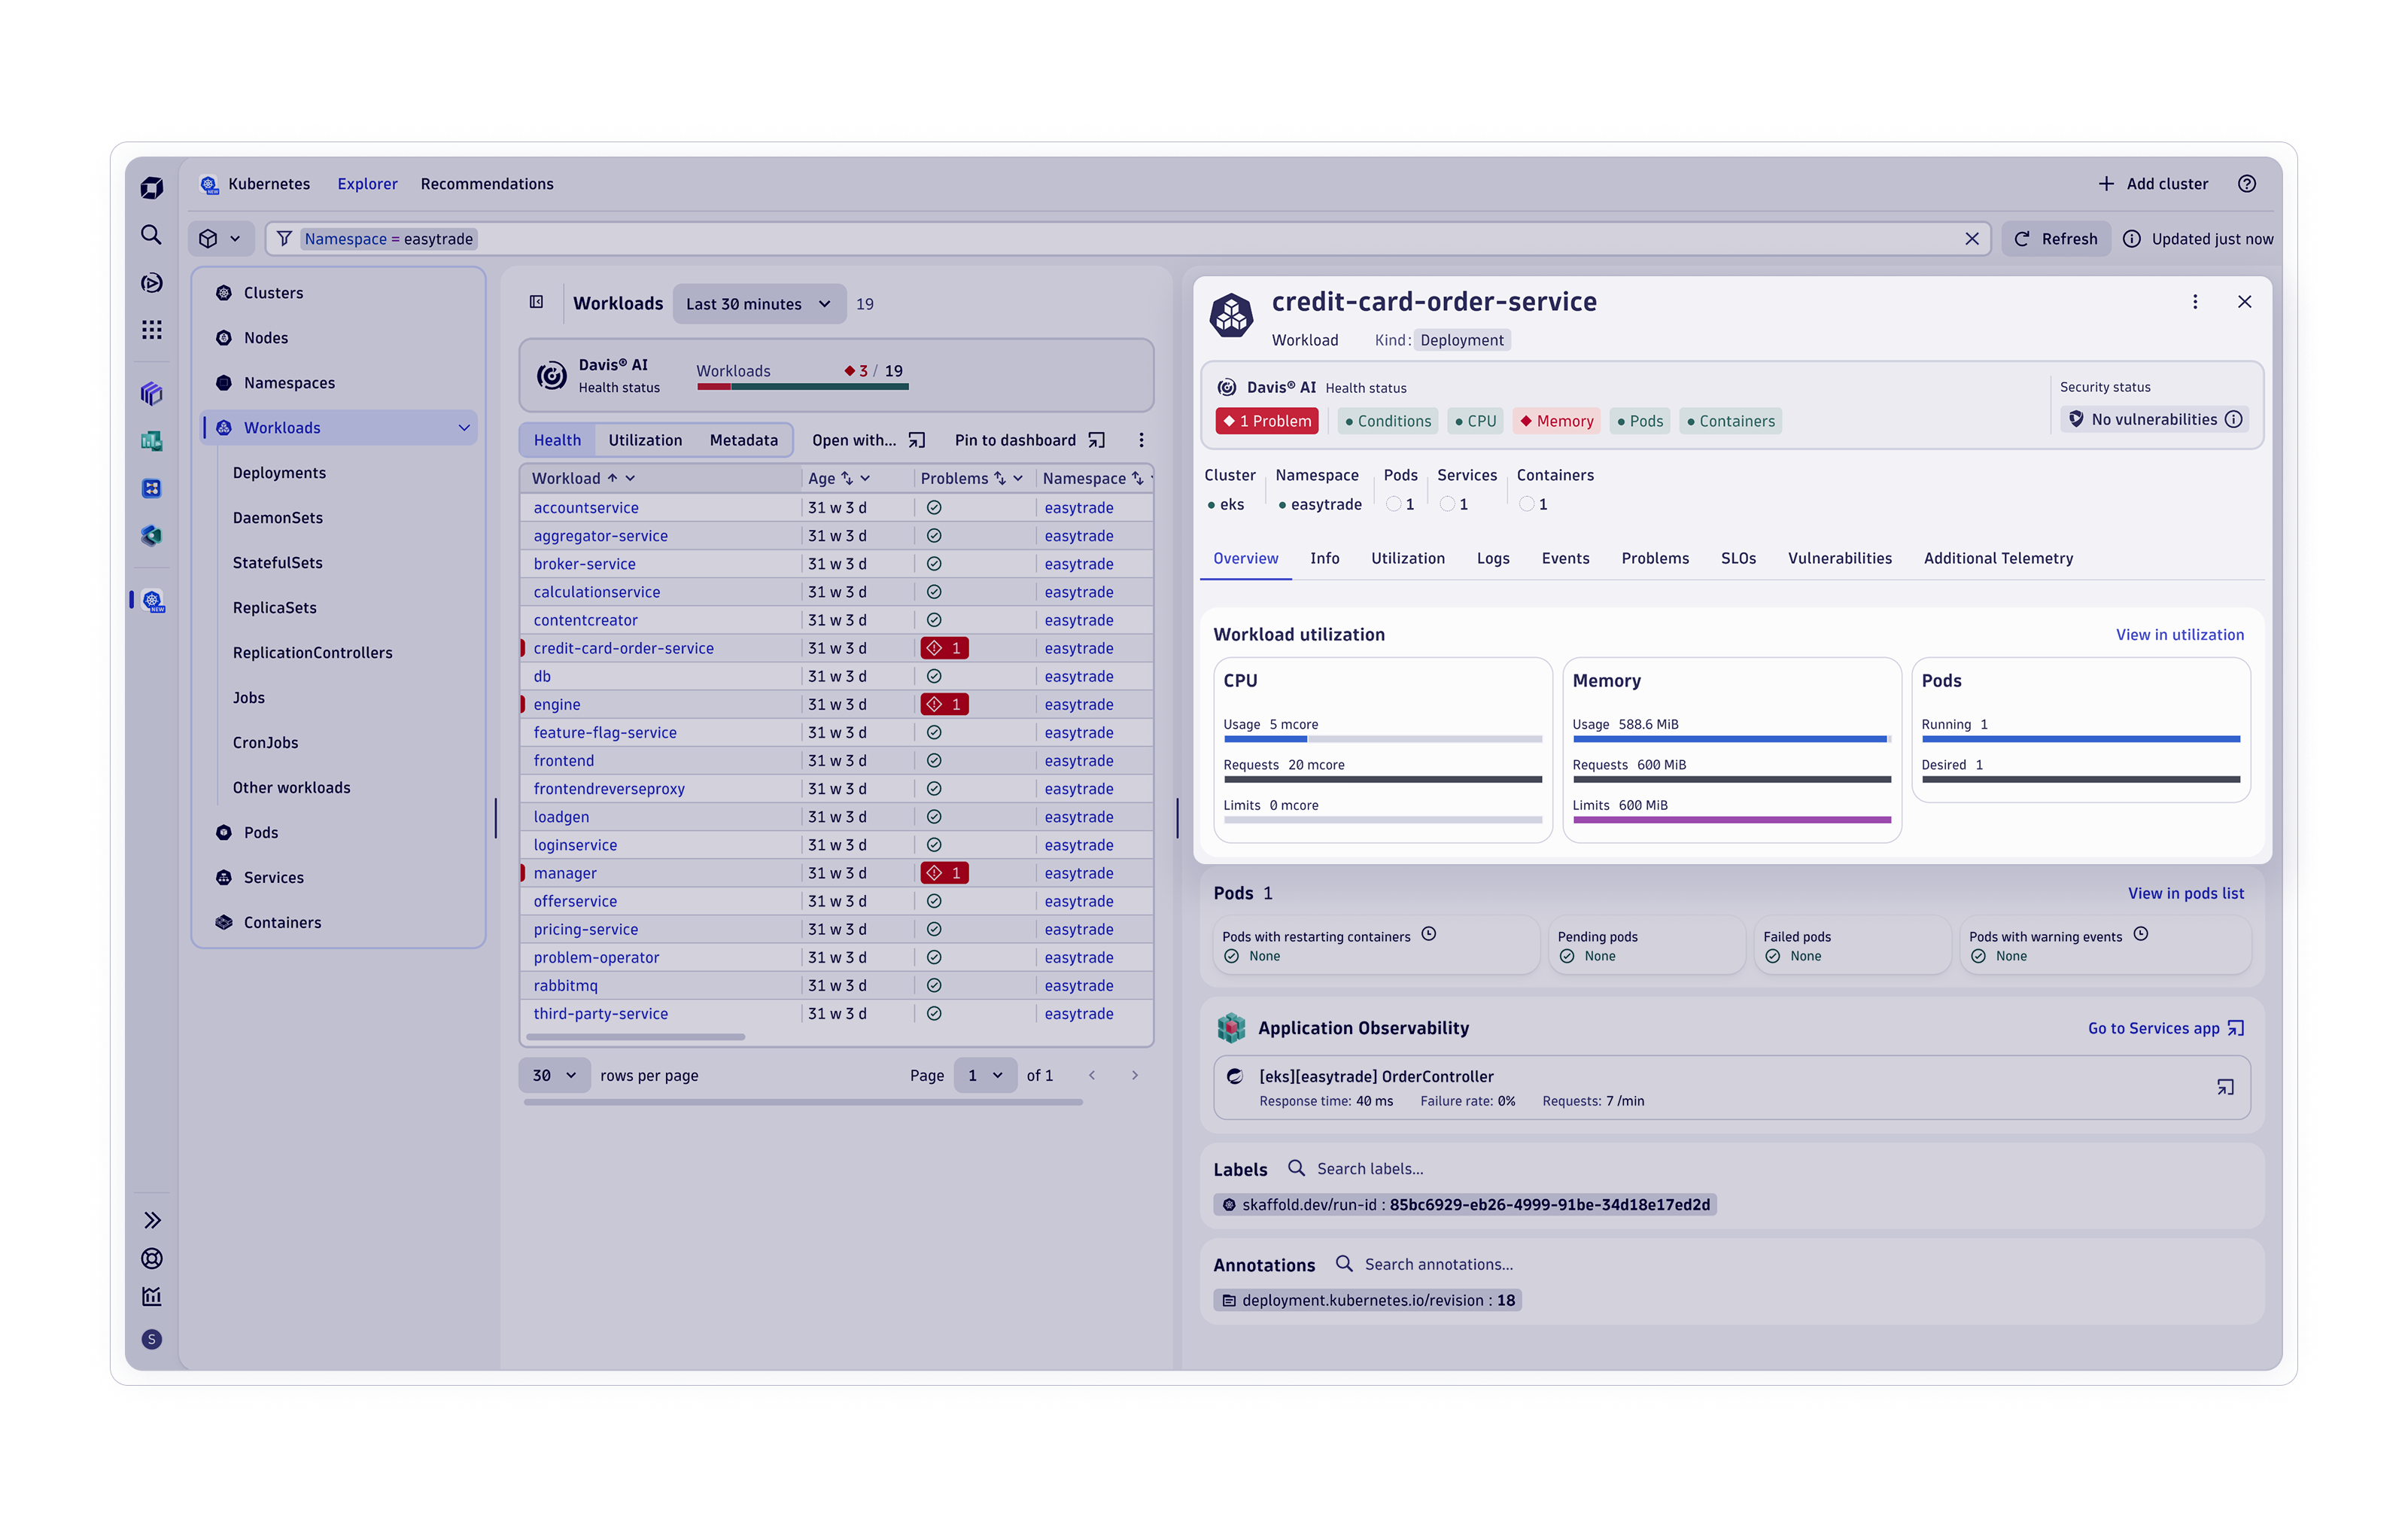
Observability der Infrastruktur
-
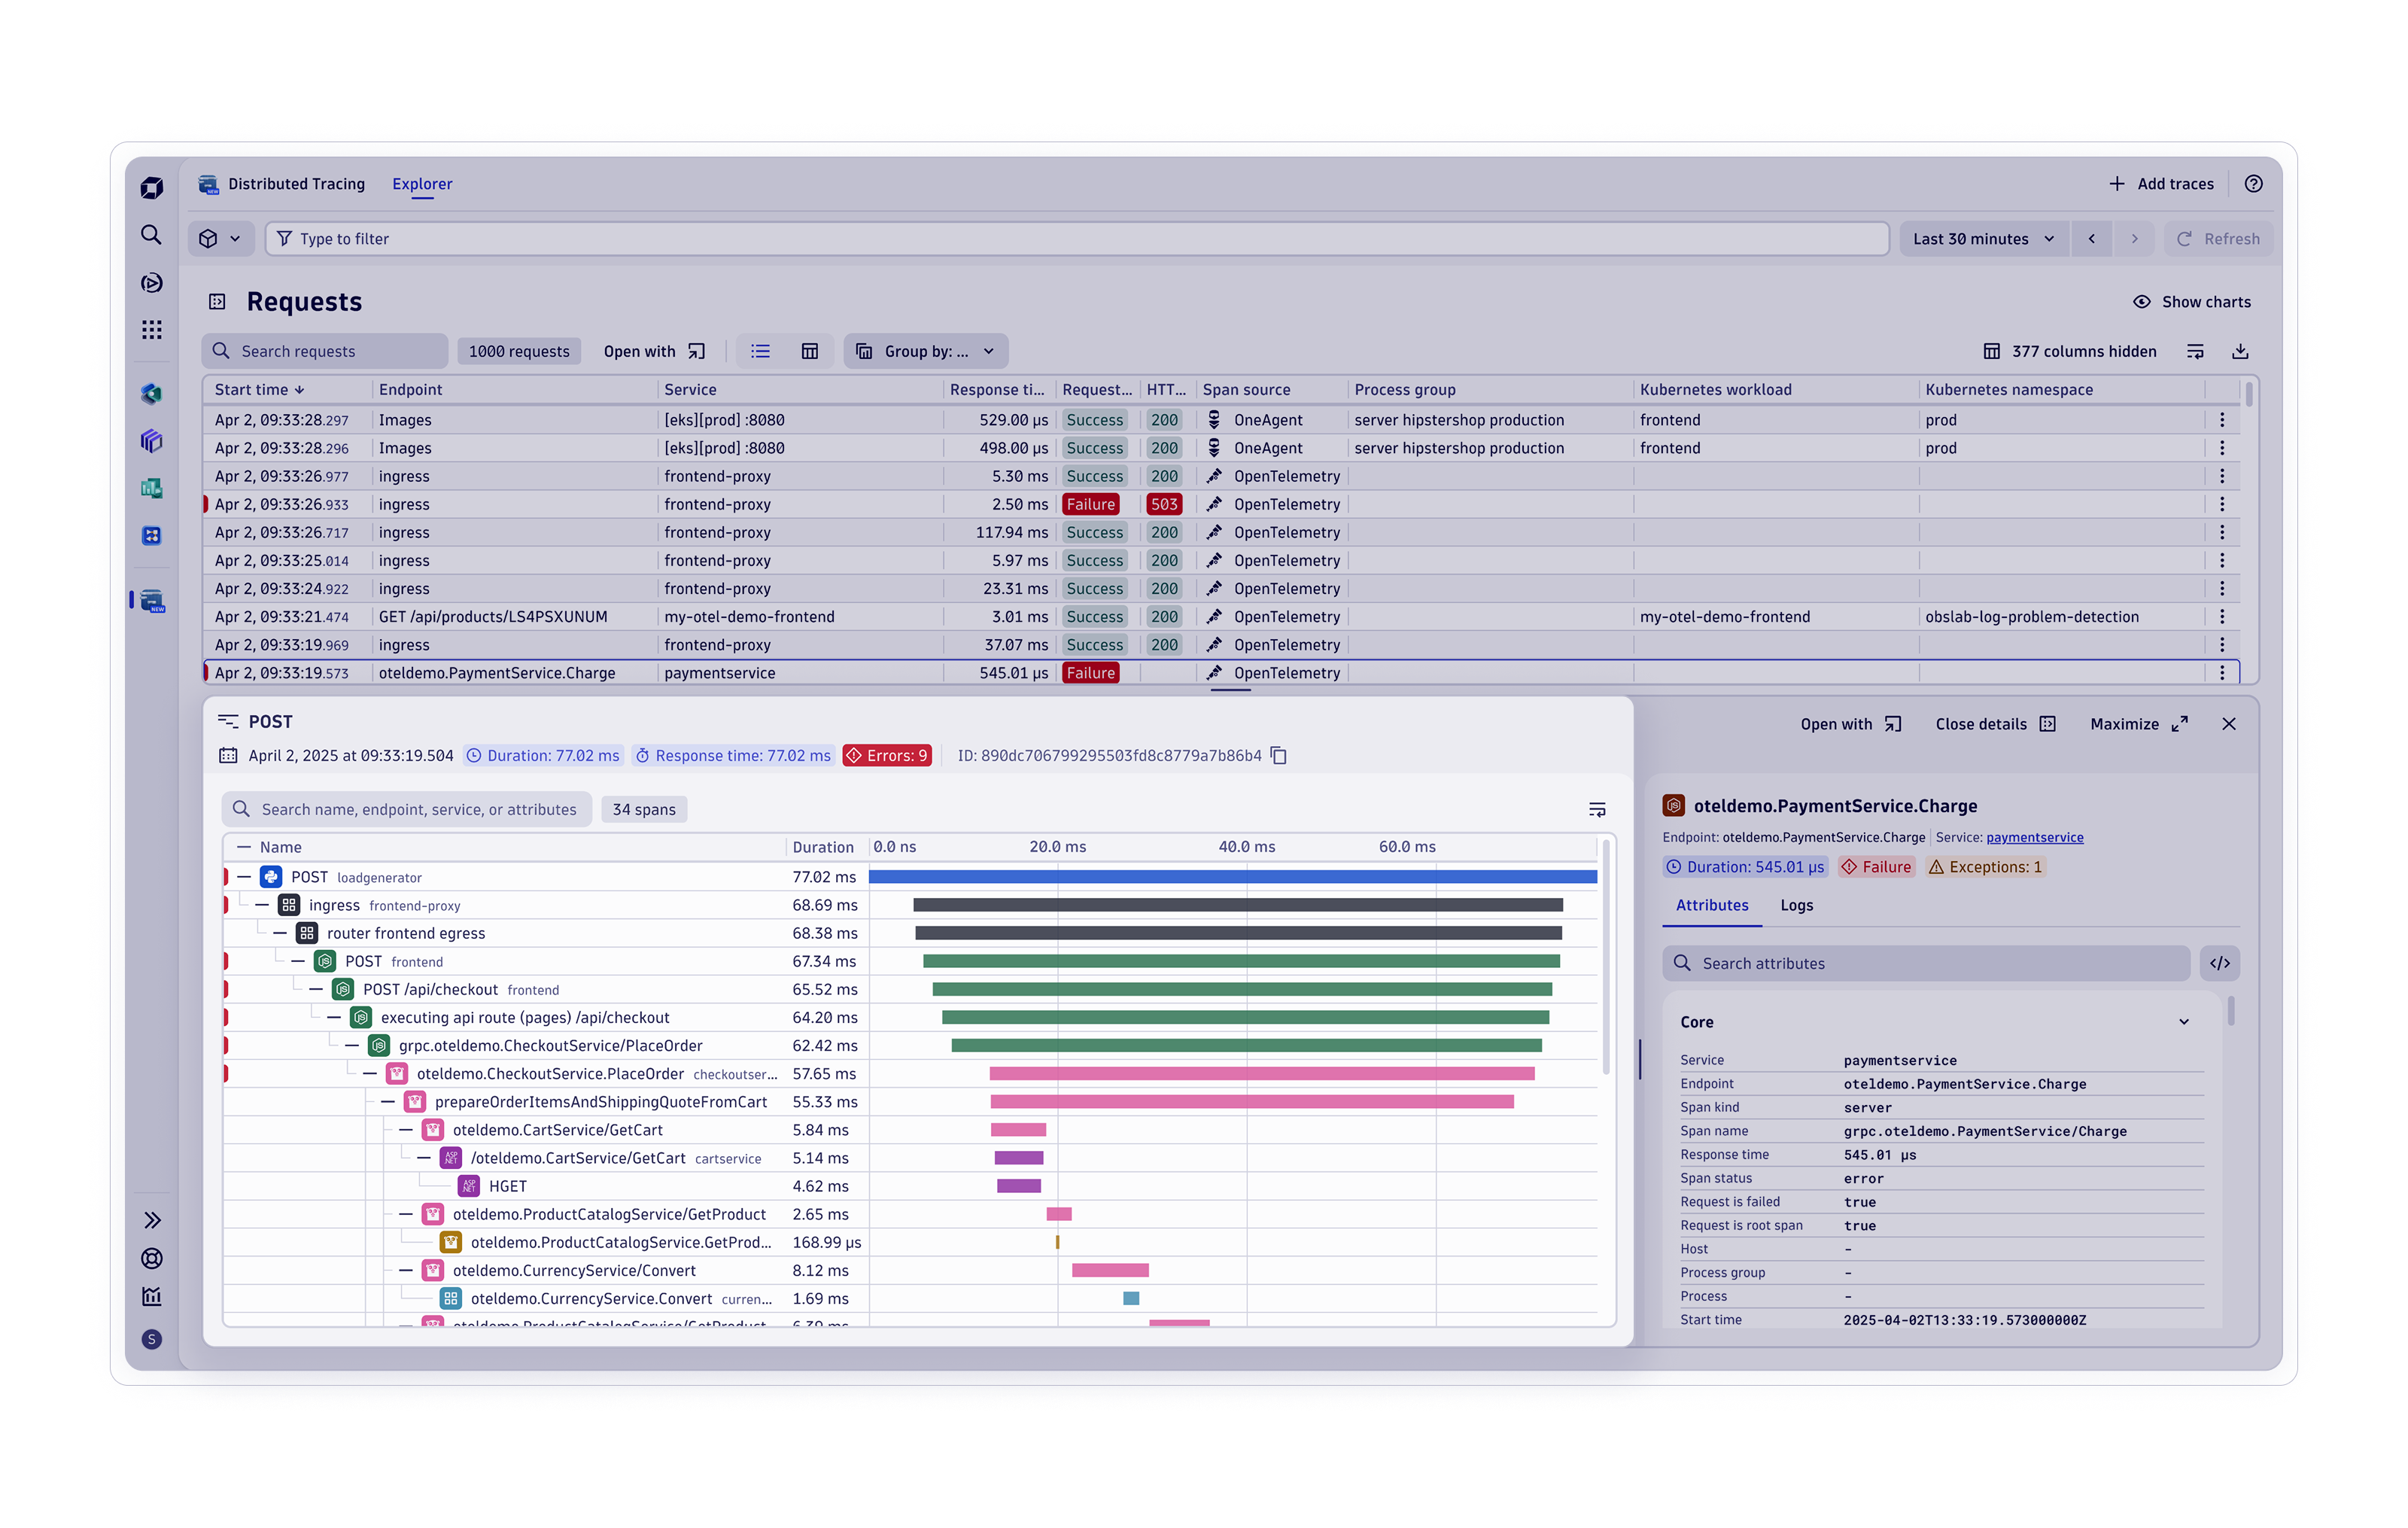
Observability von Anwendungen
-
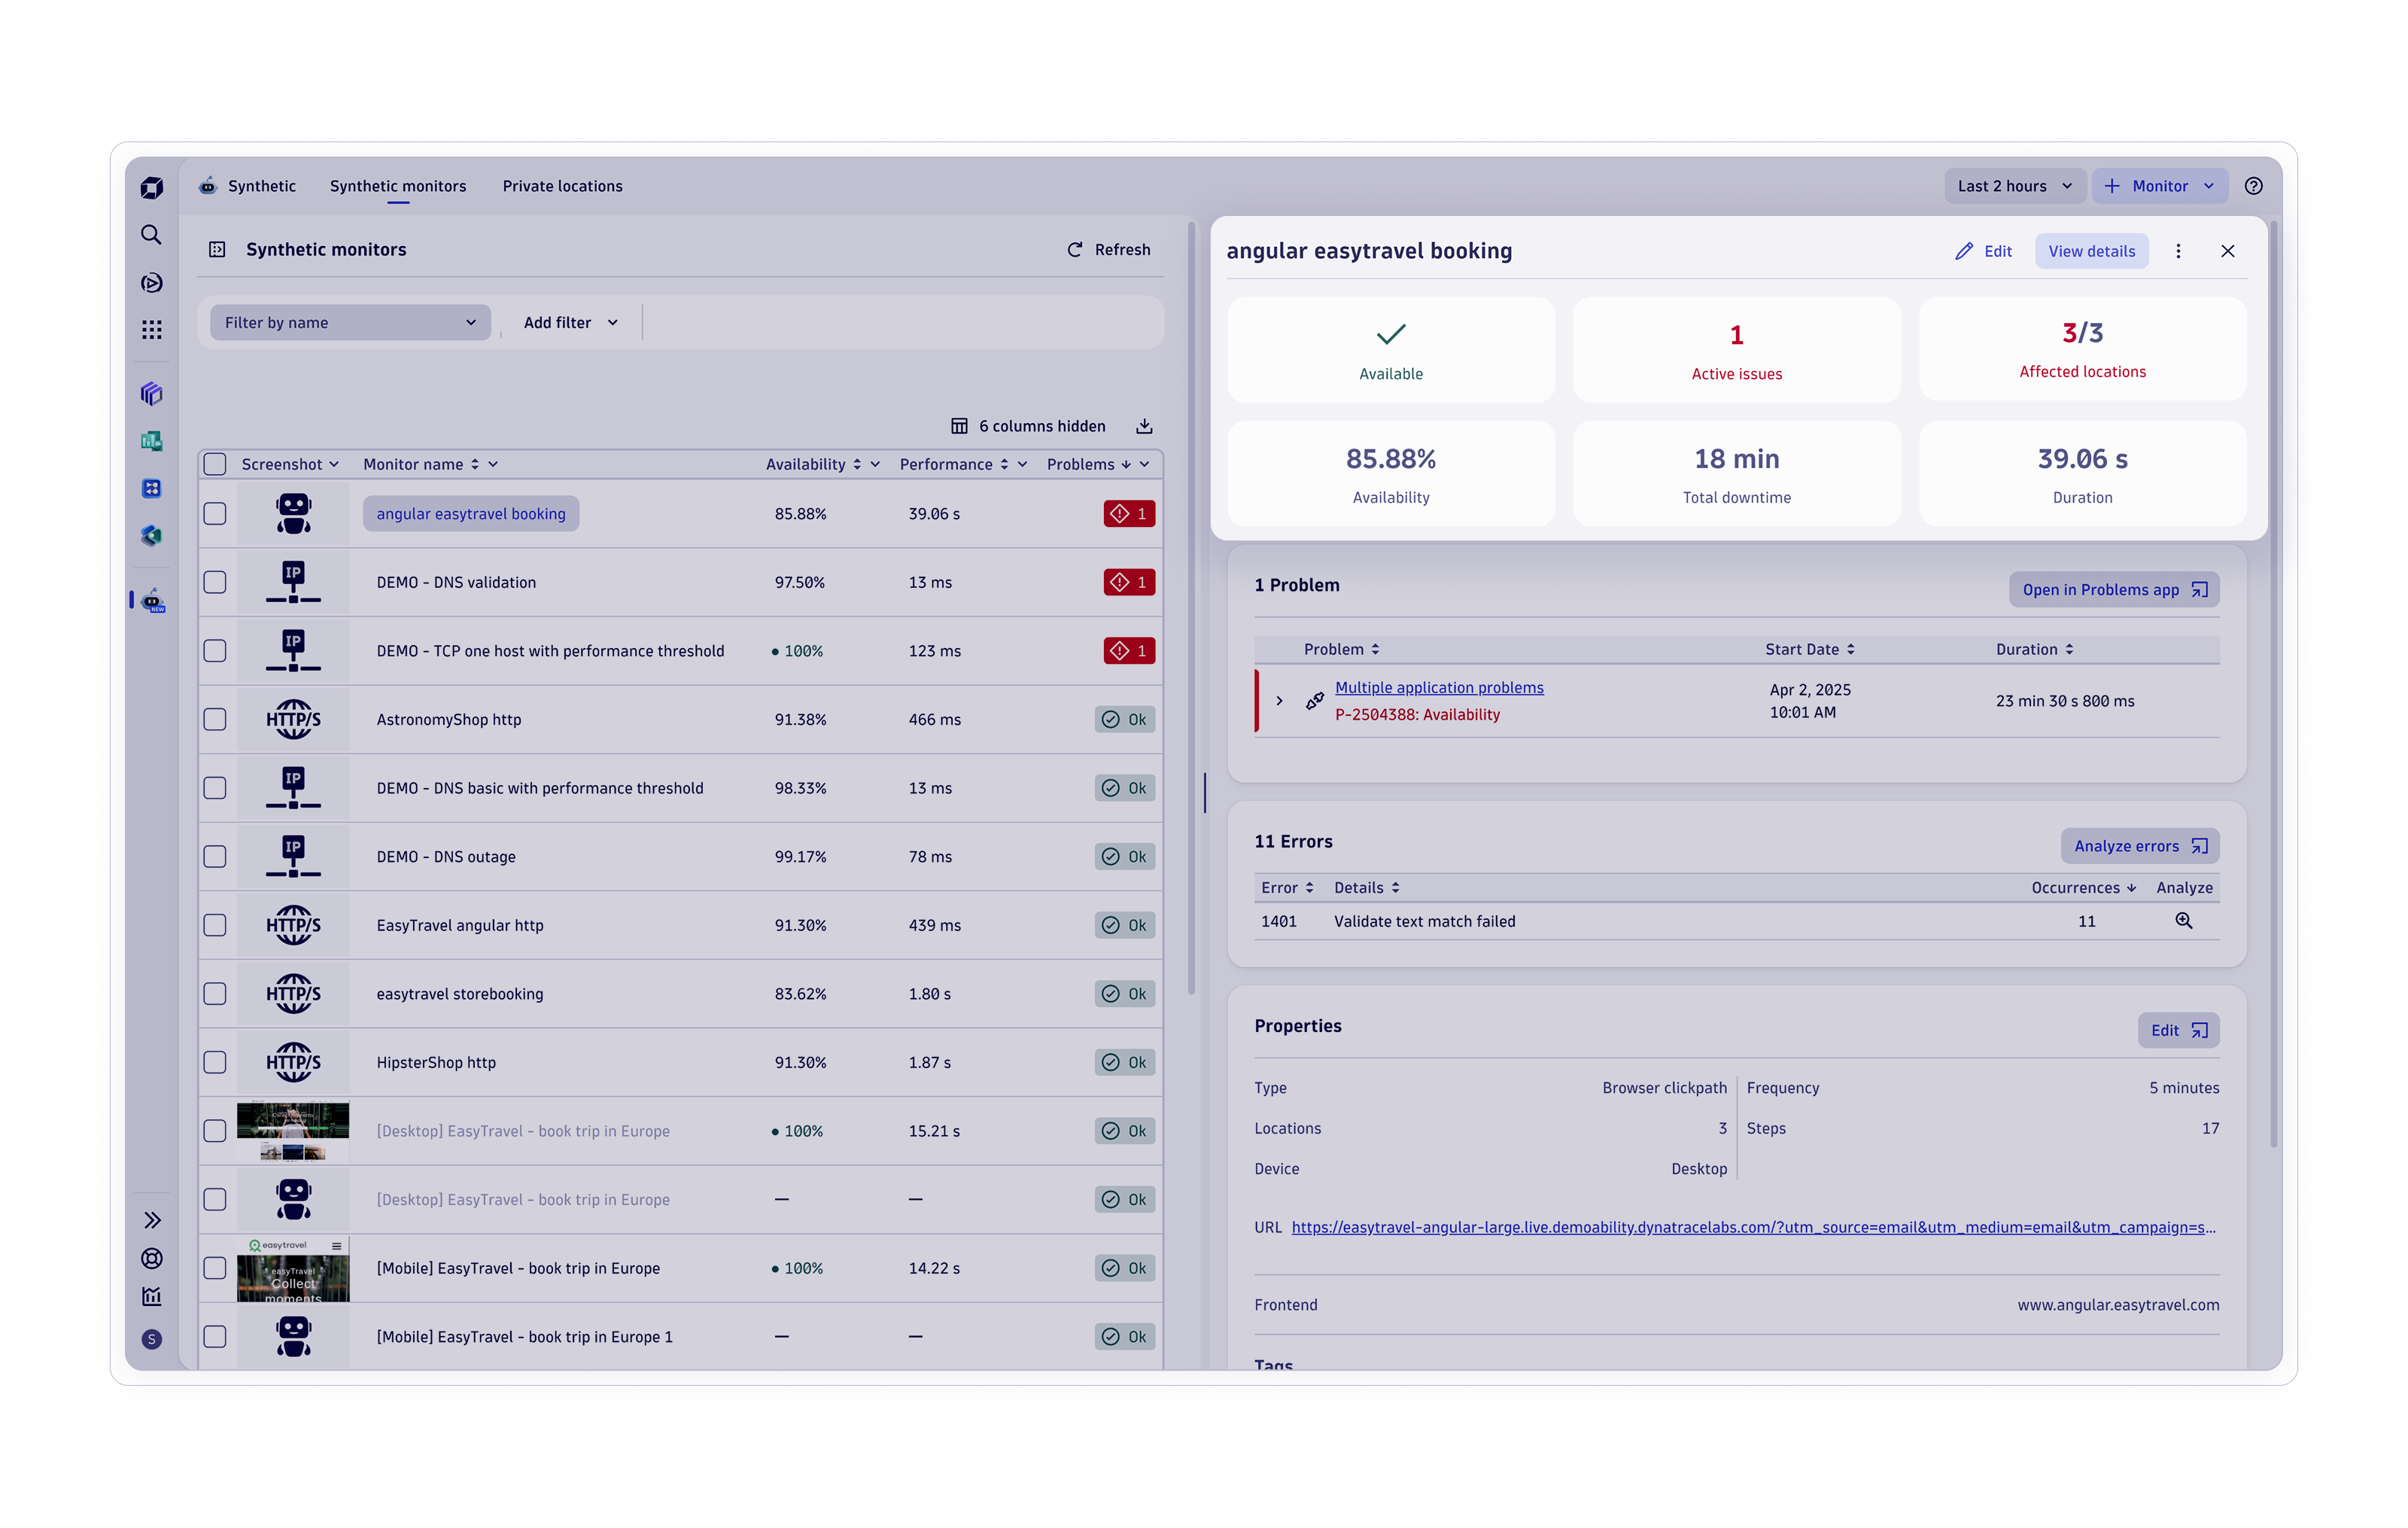
Digitale Angebote
-
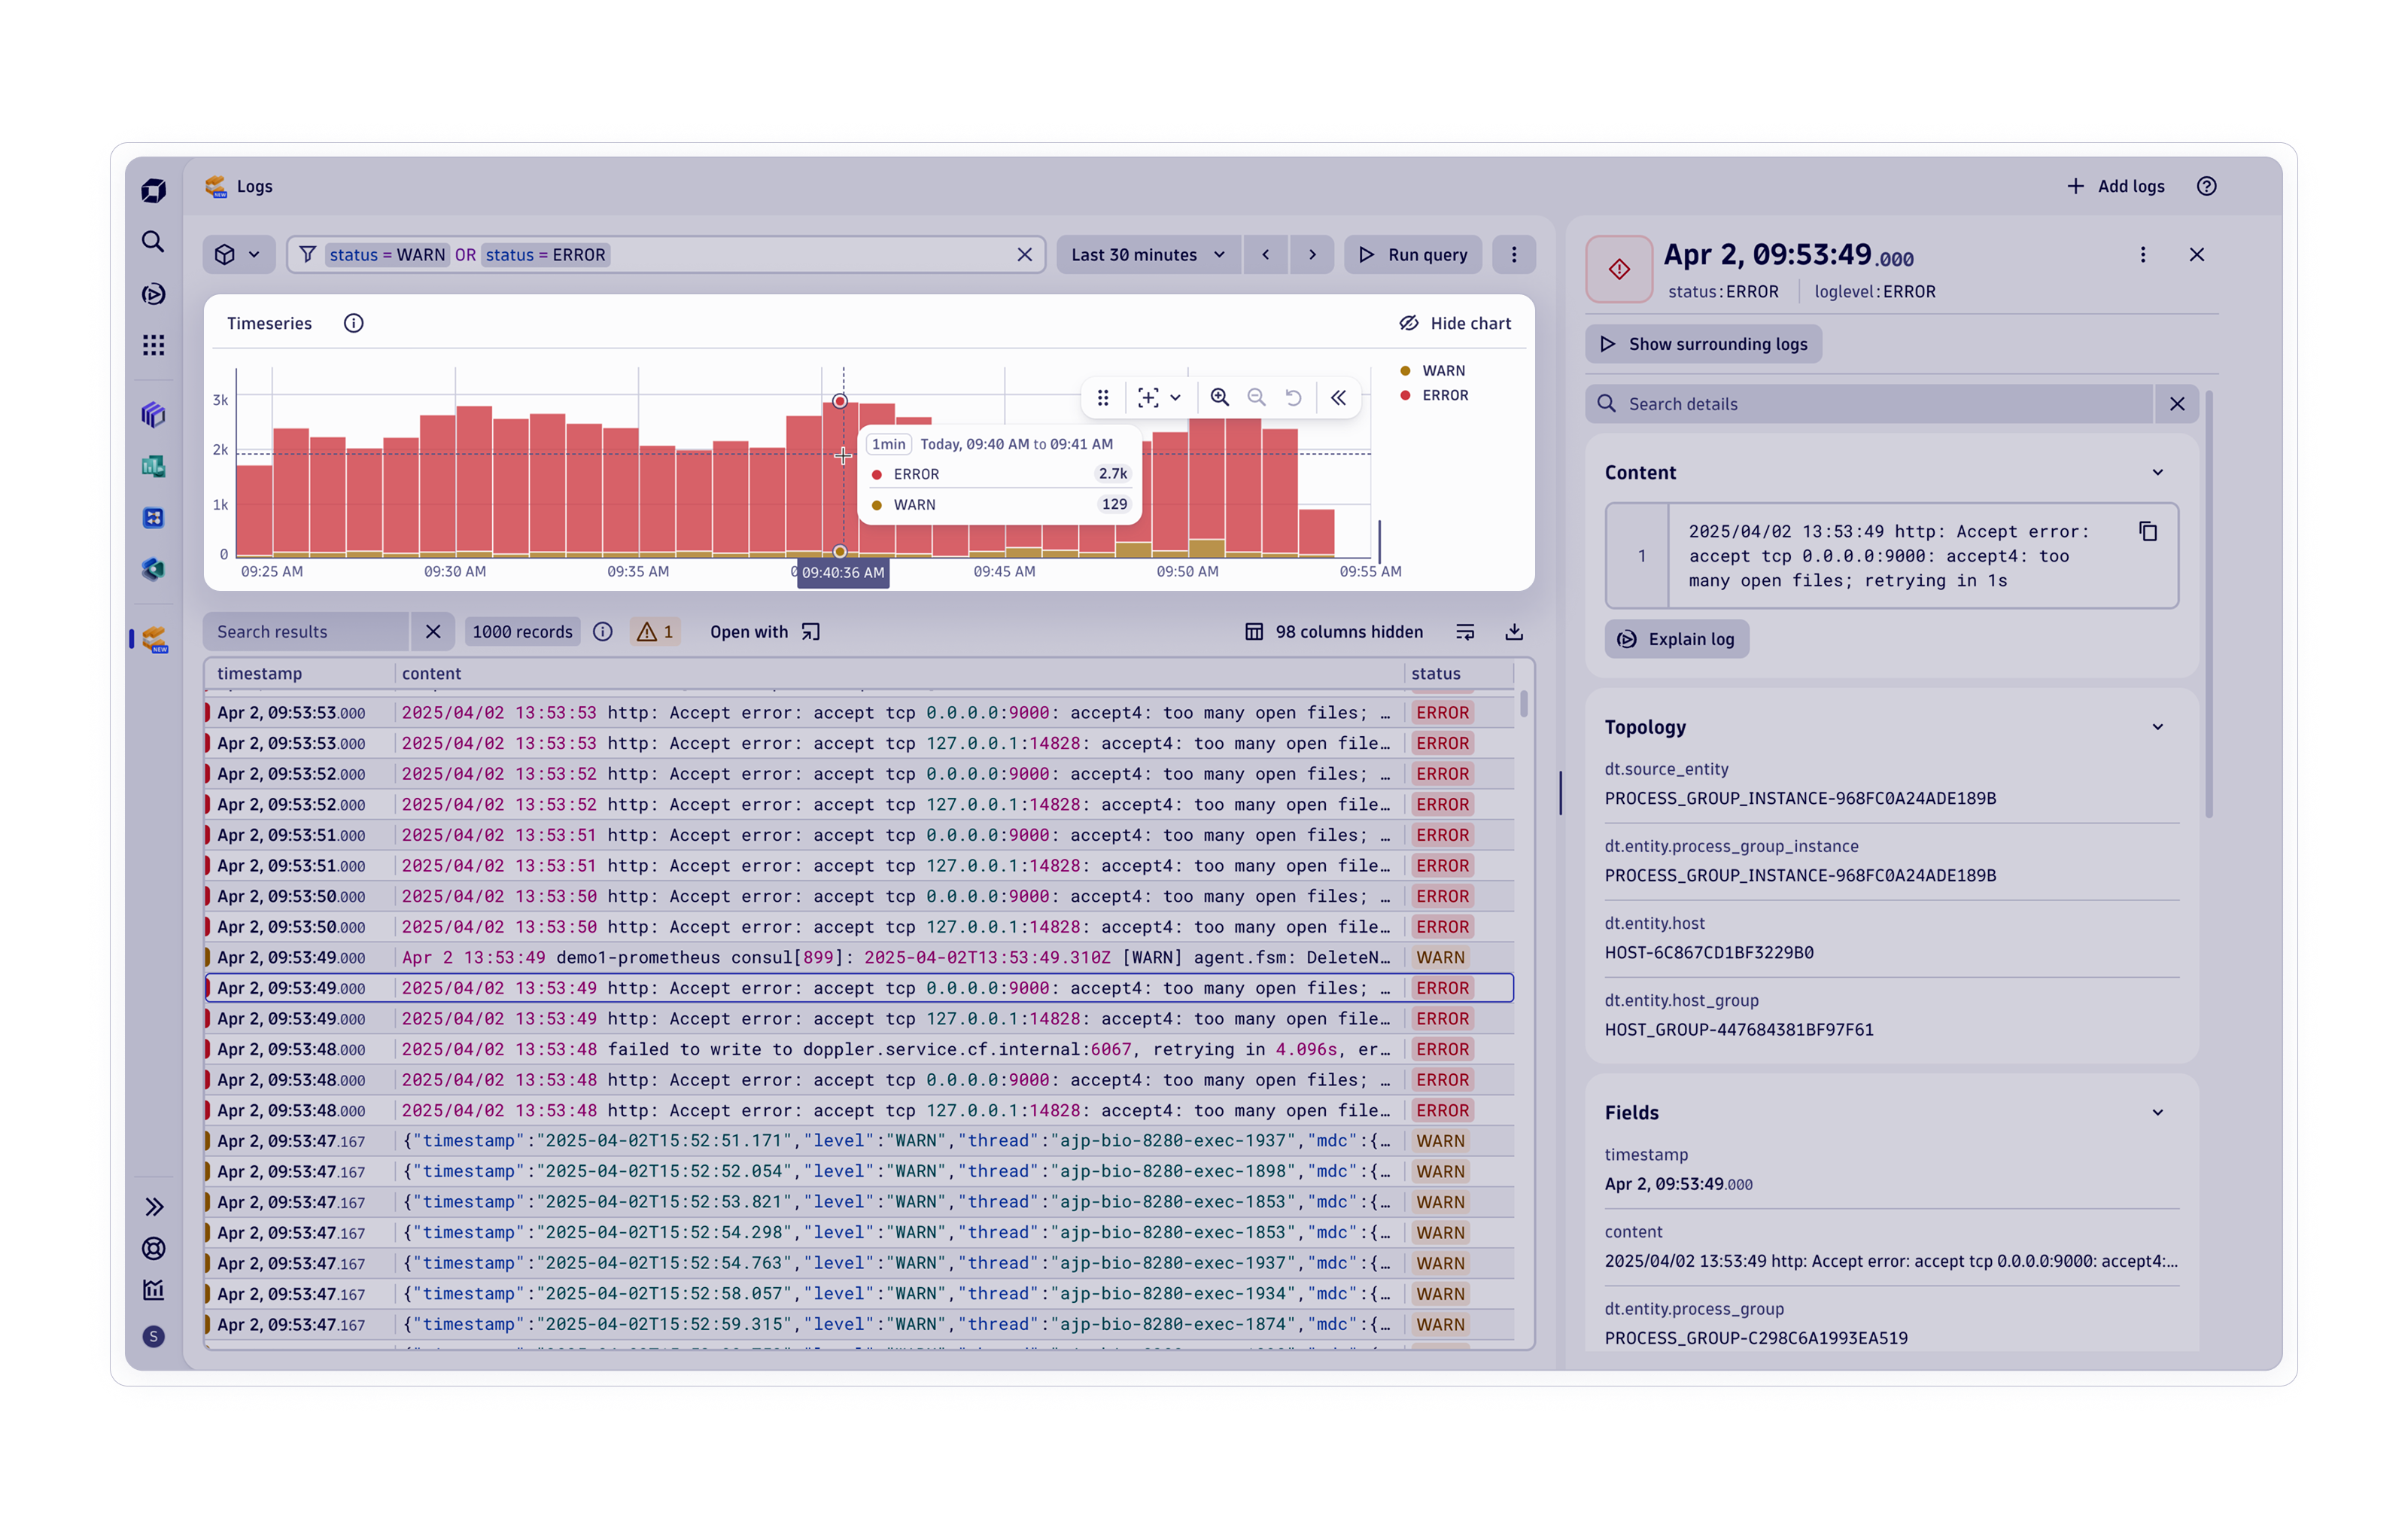
Log-Analyse
-
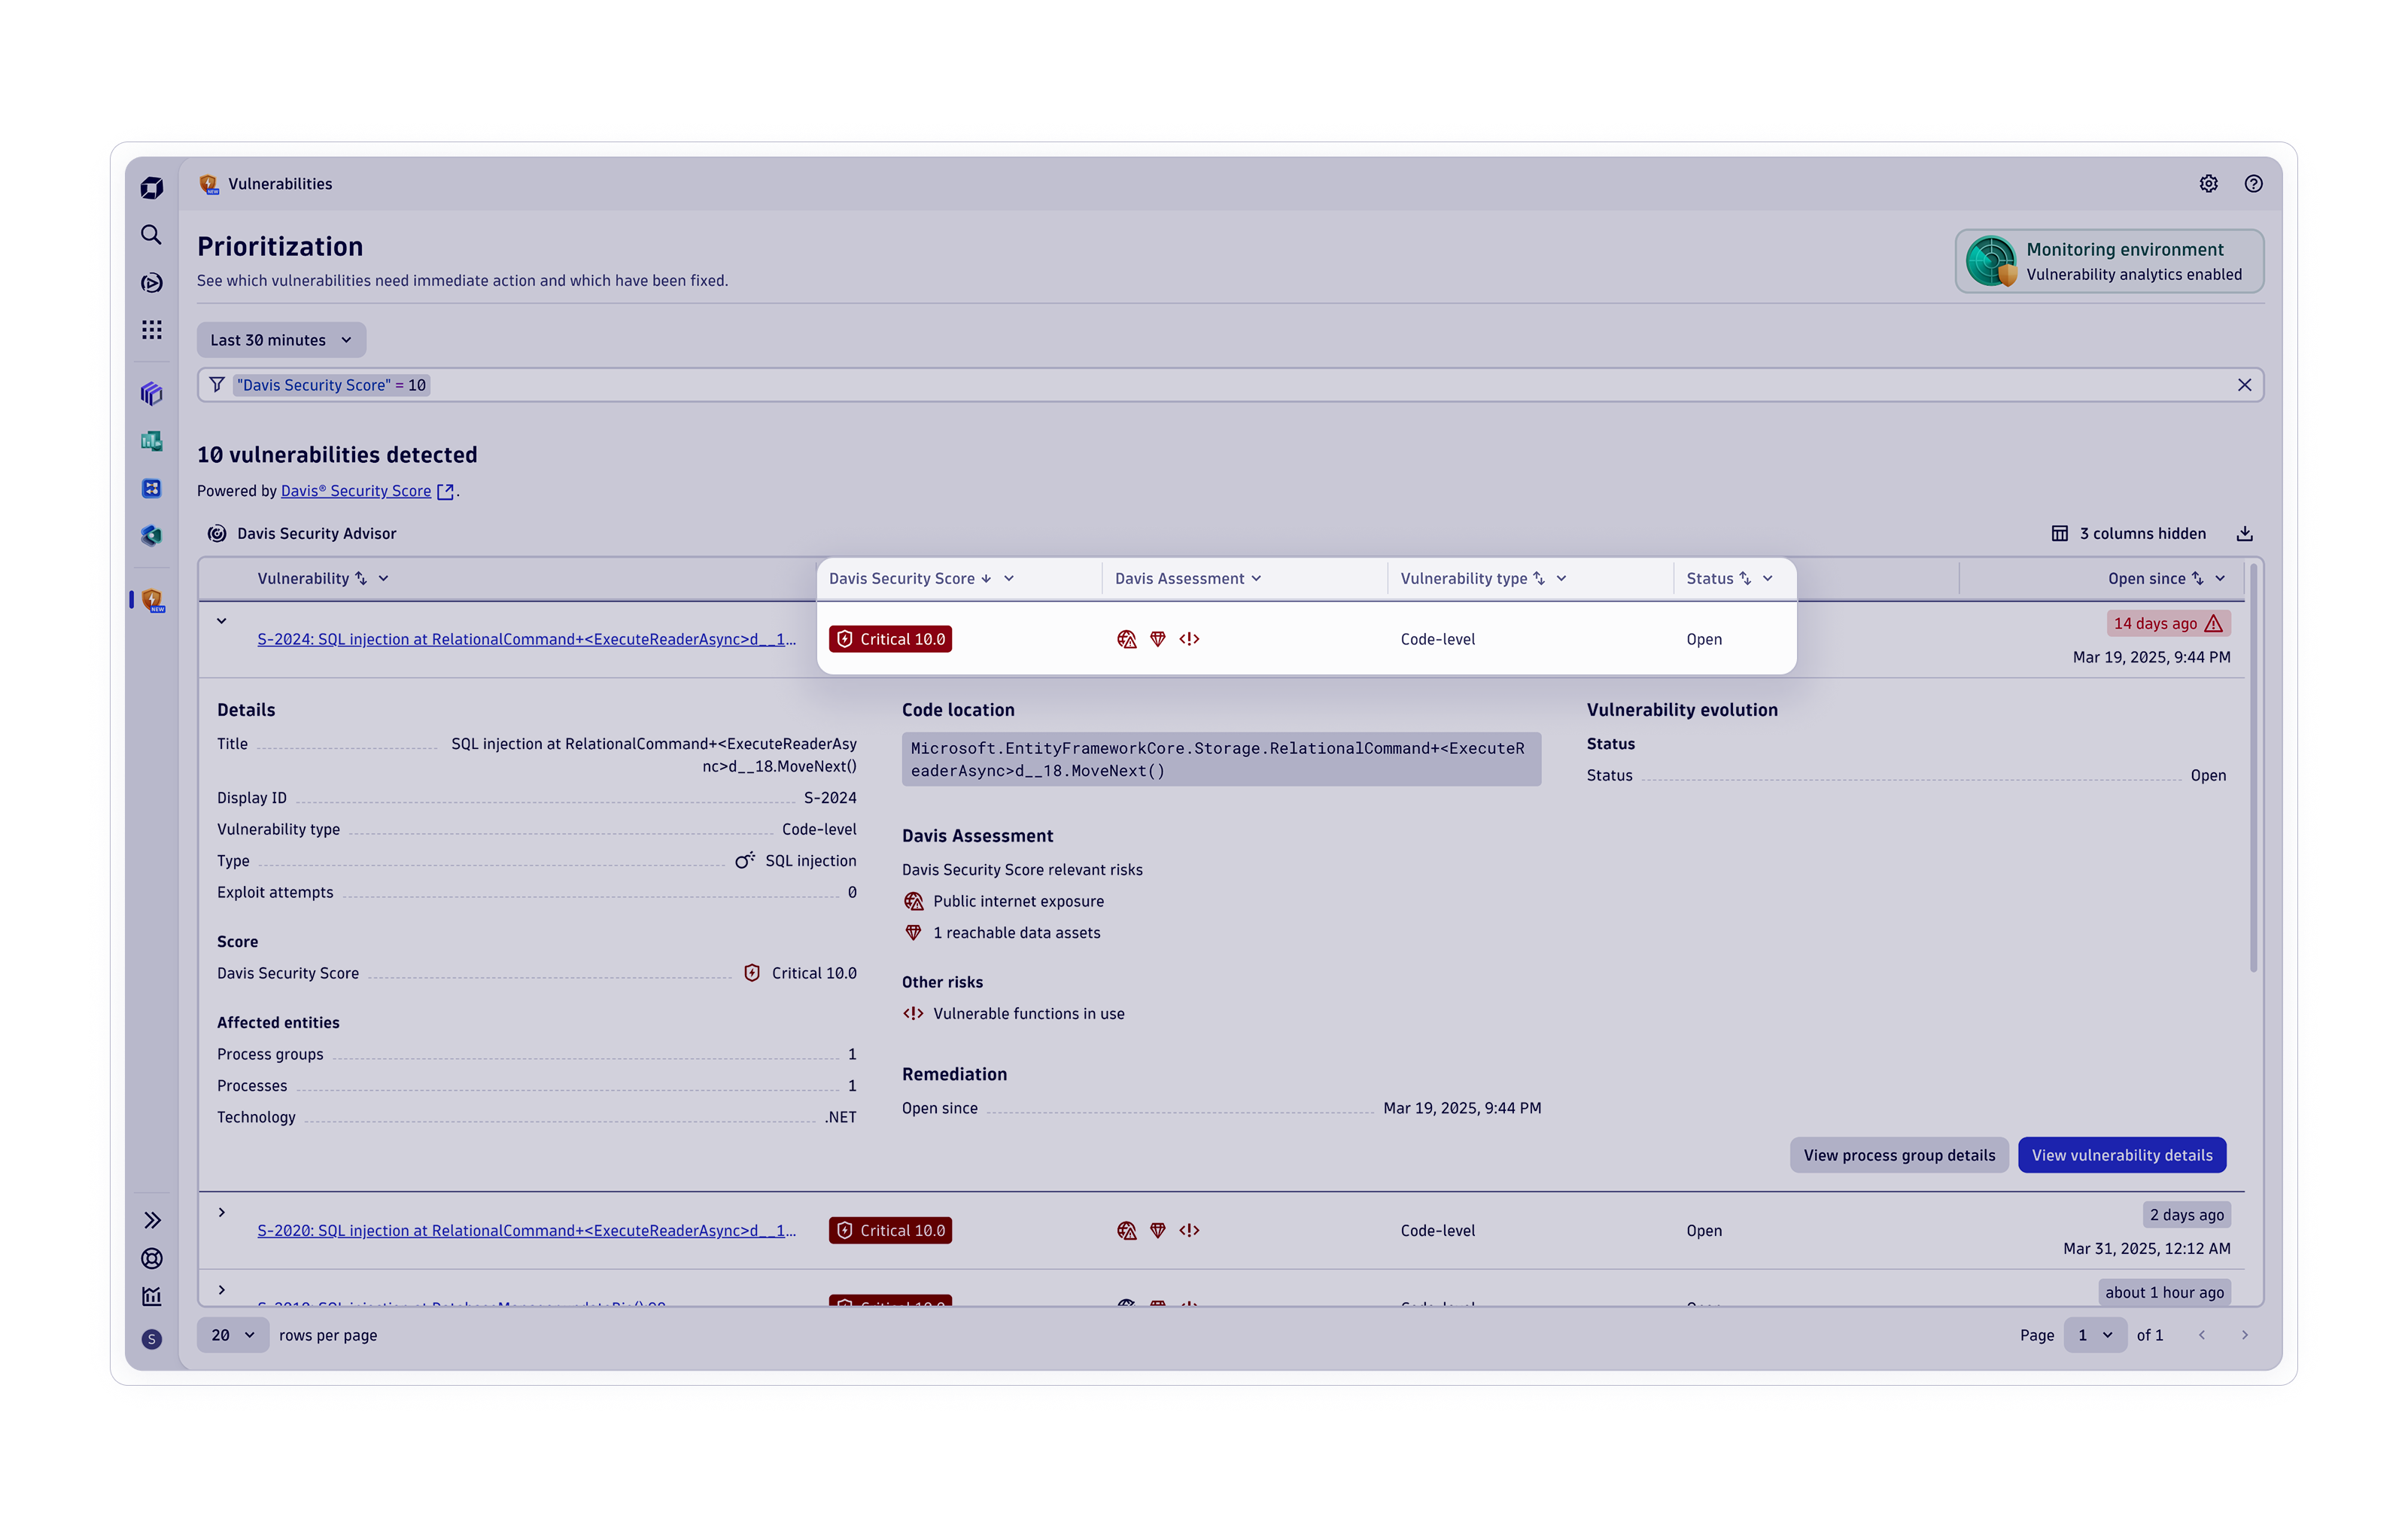
Anwendungssicherheit
-
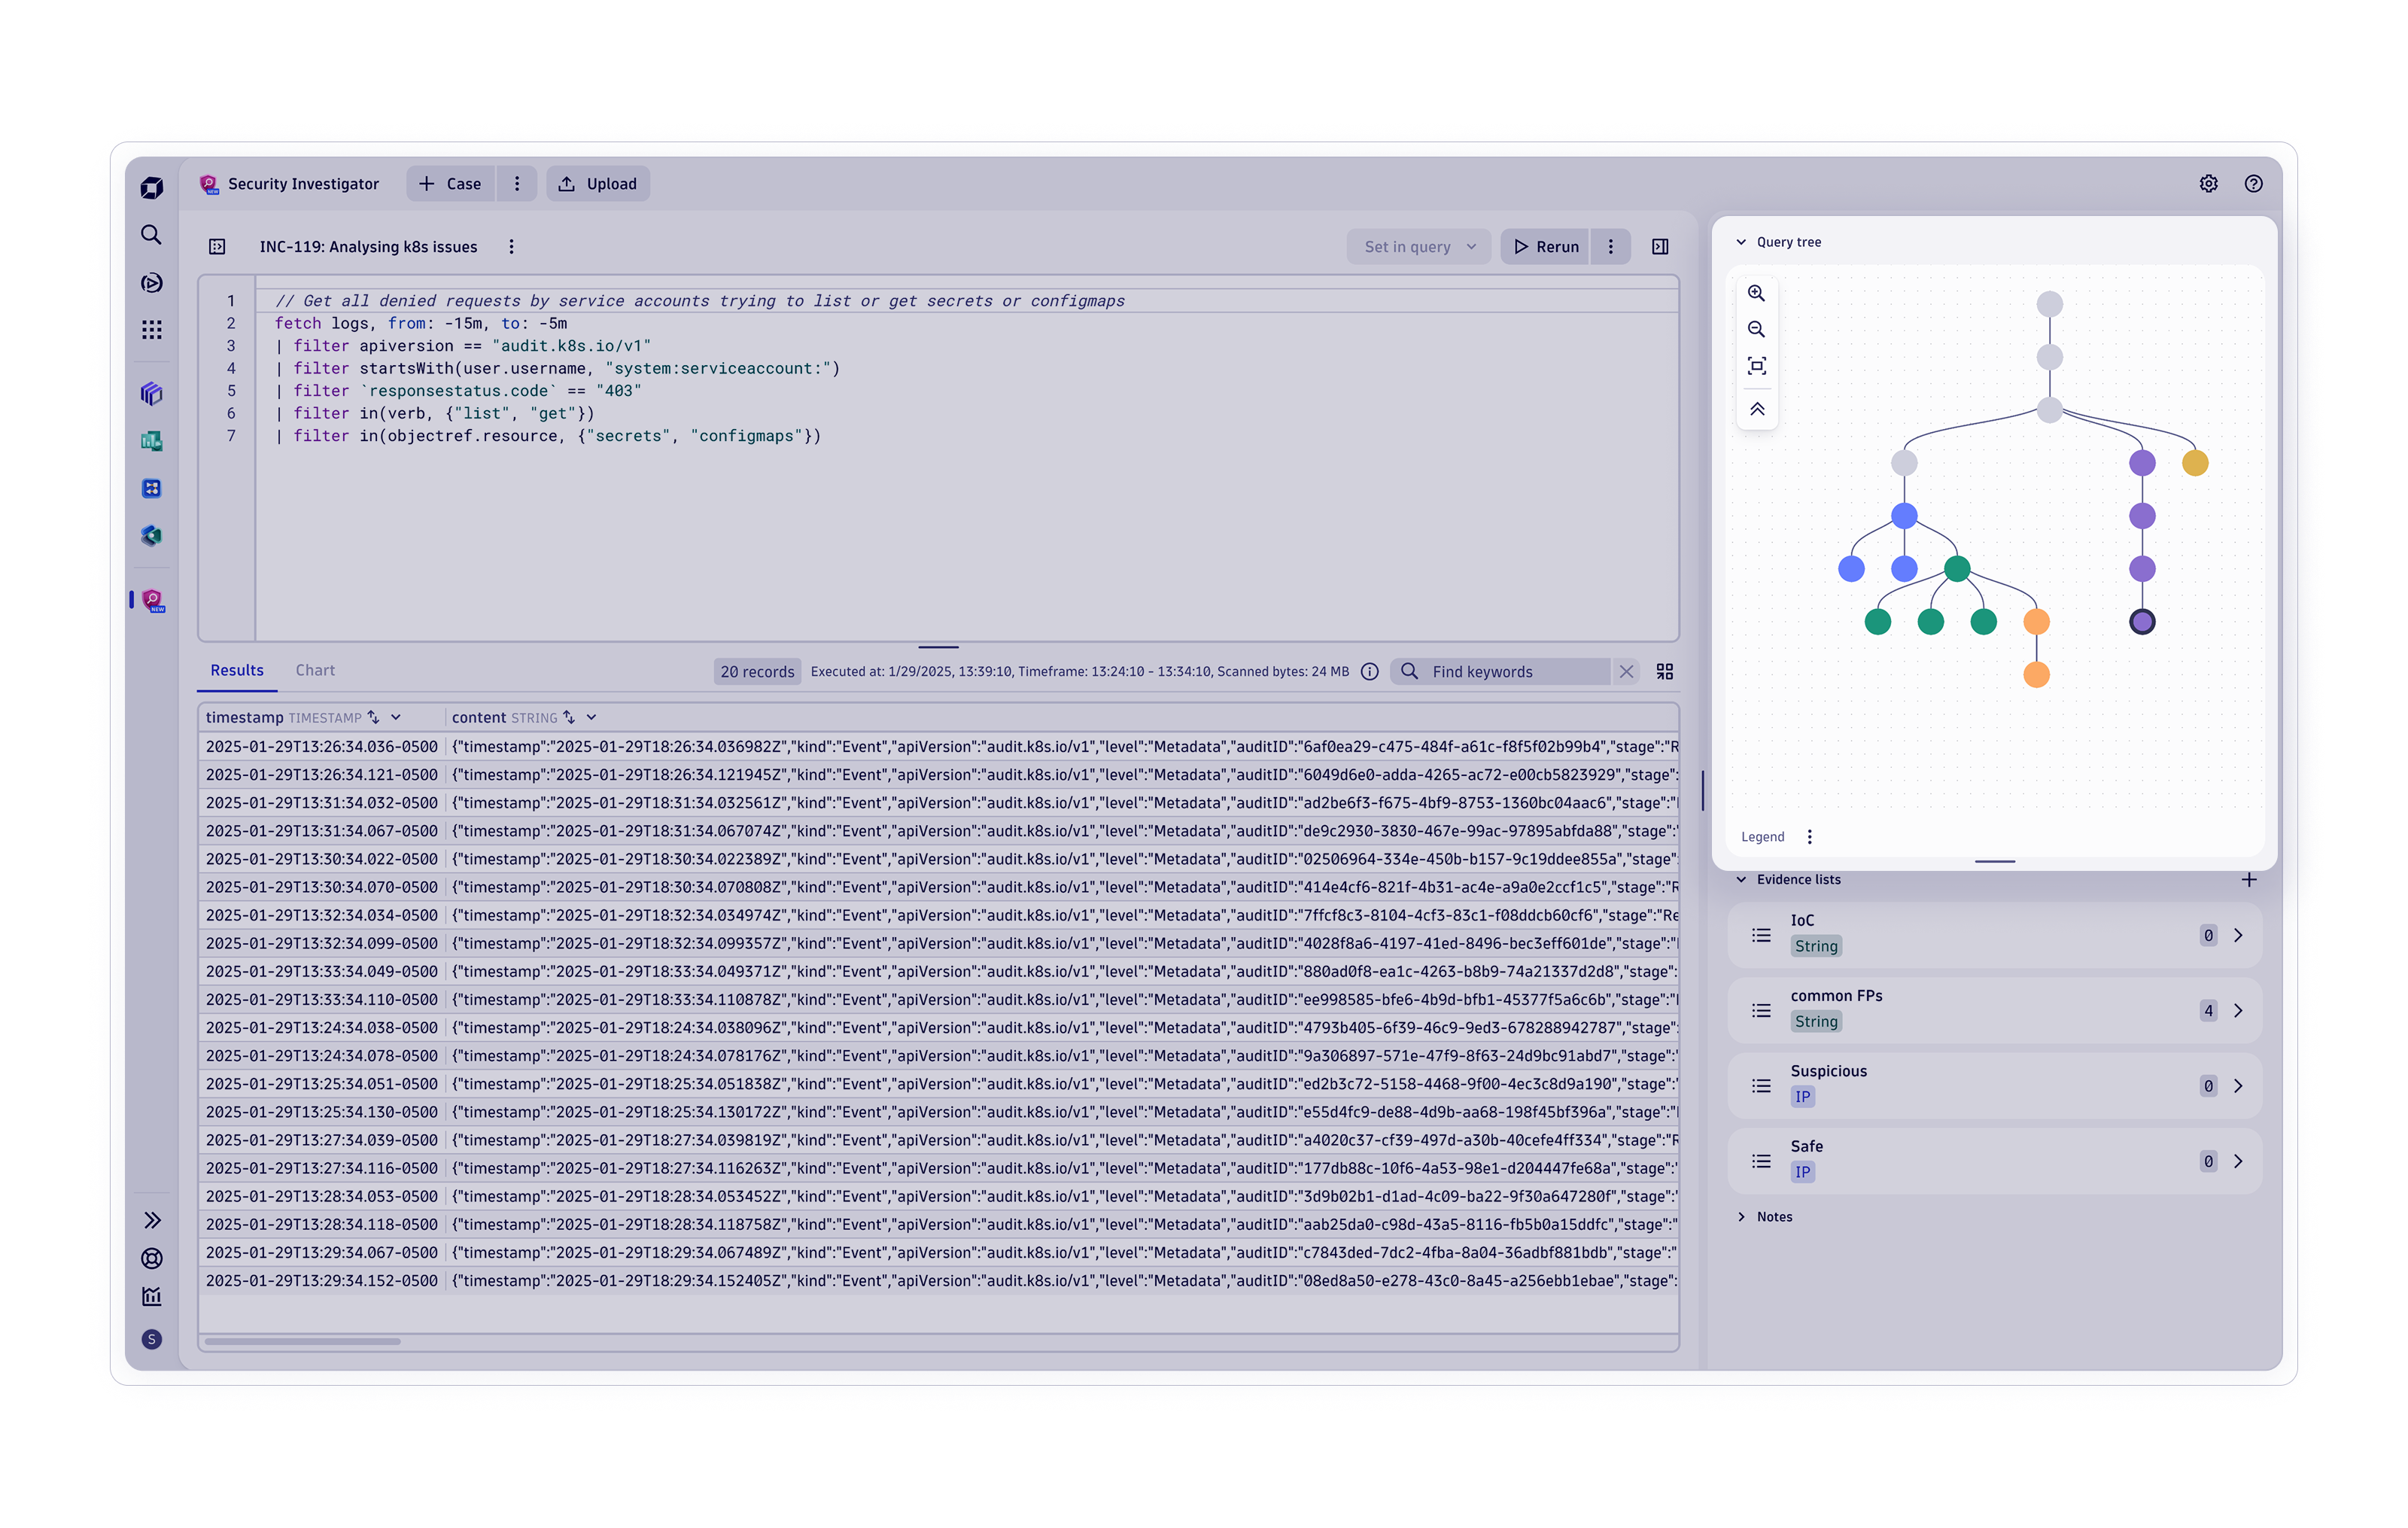
Threat-Observability
-
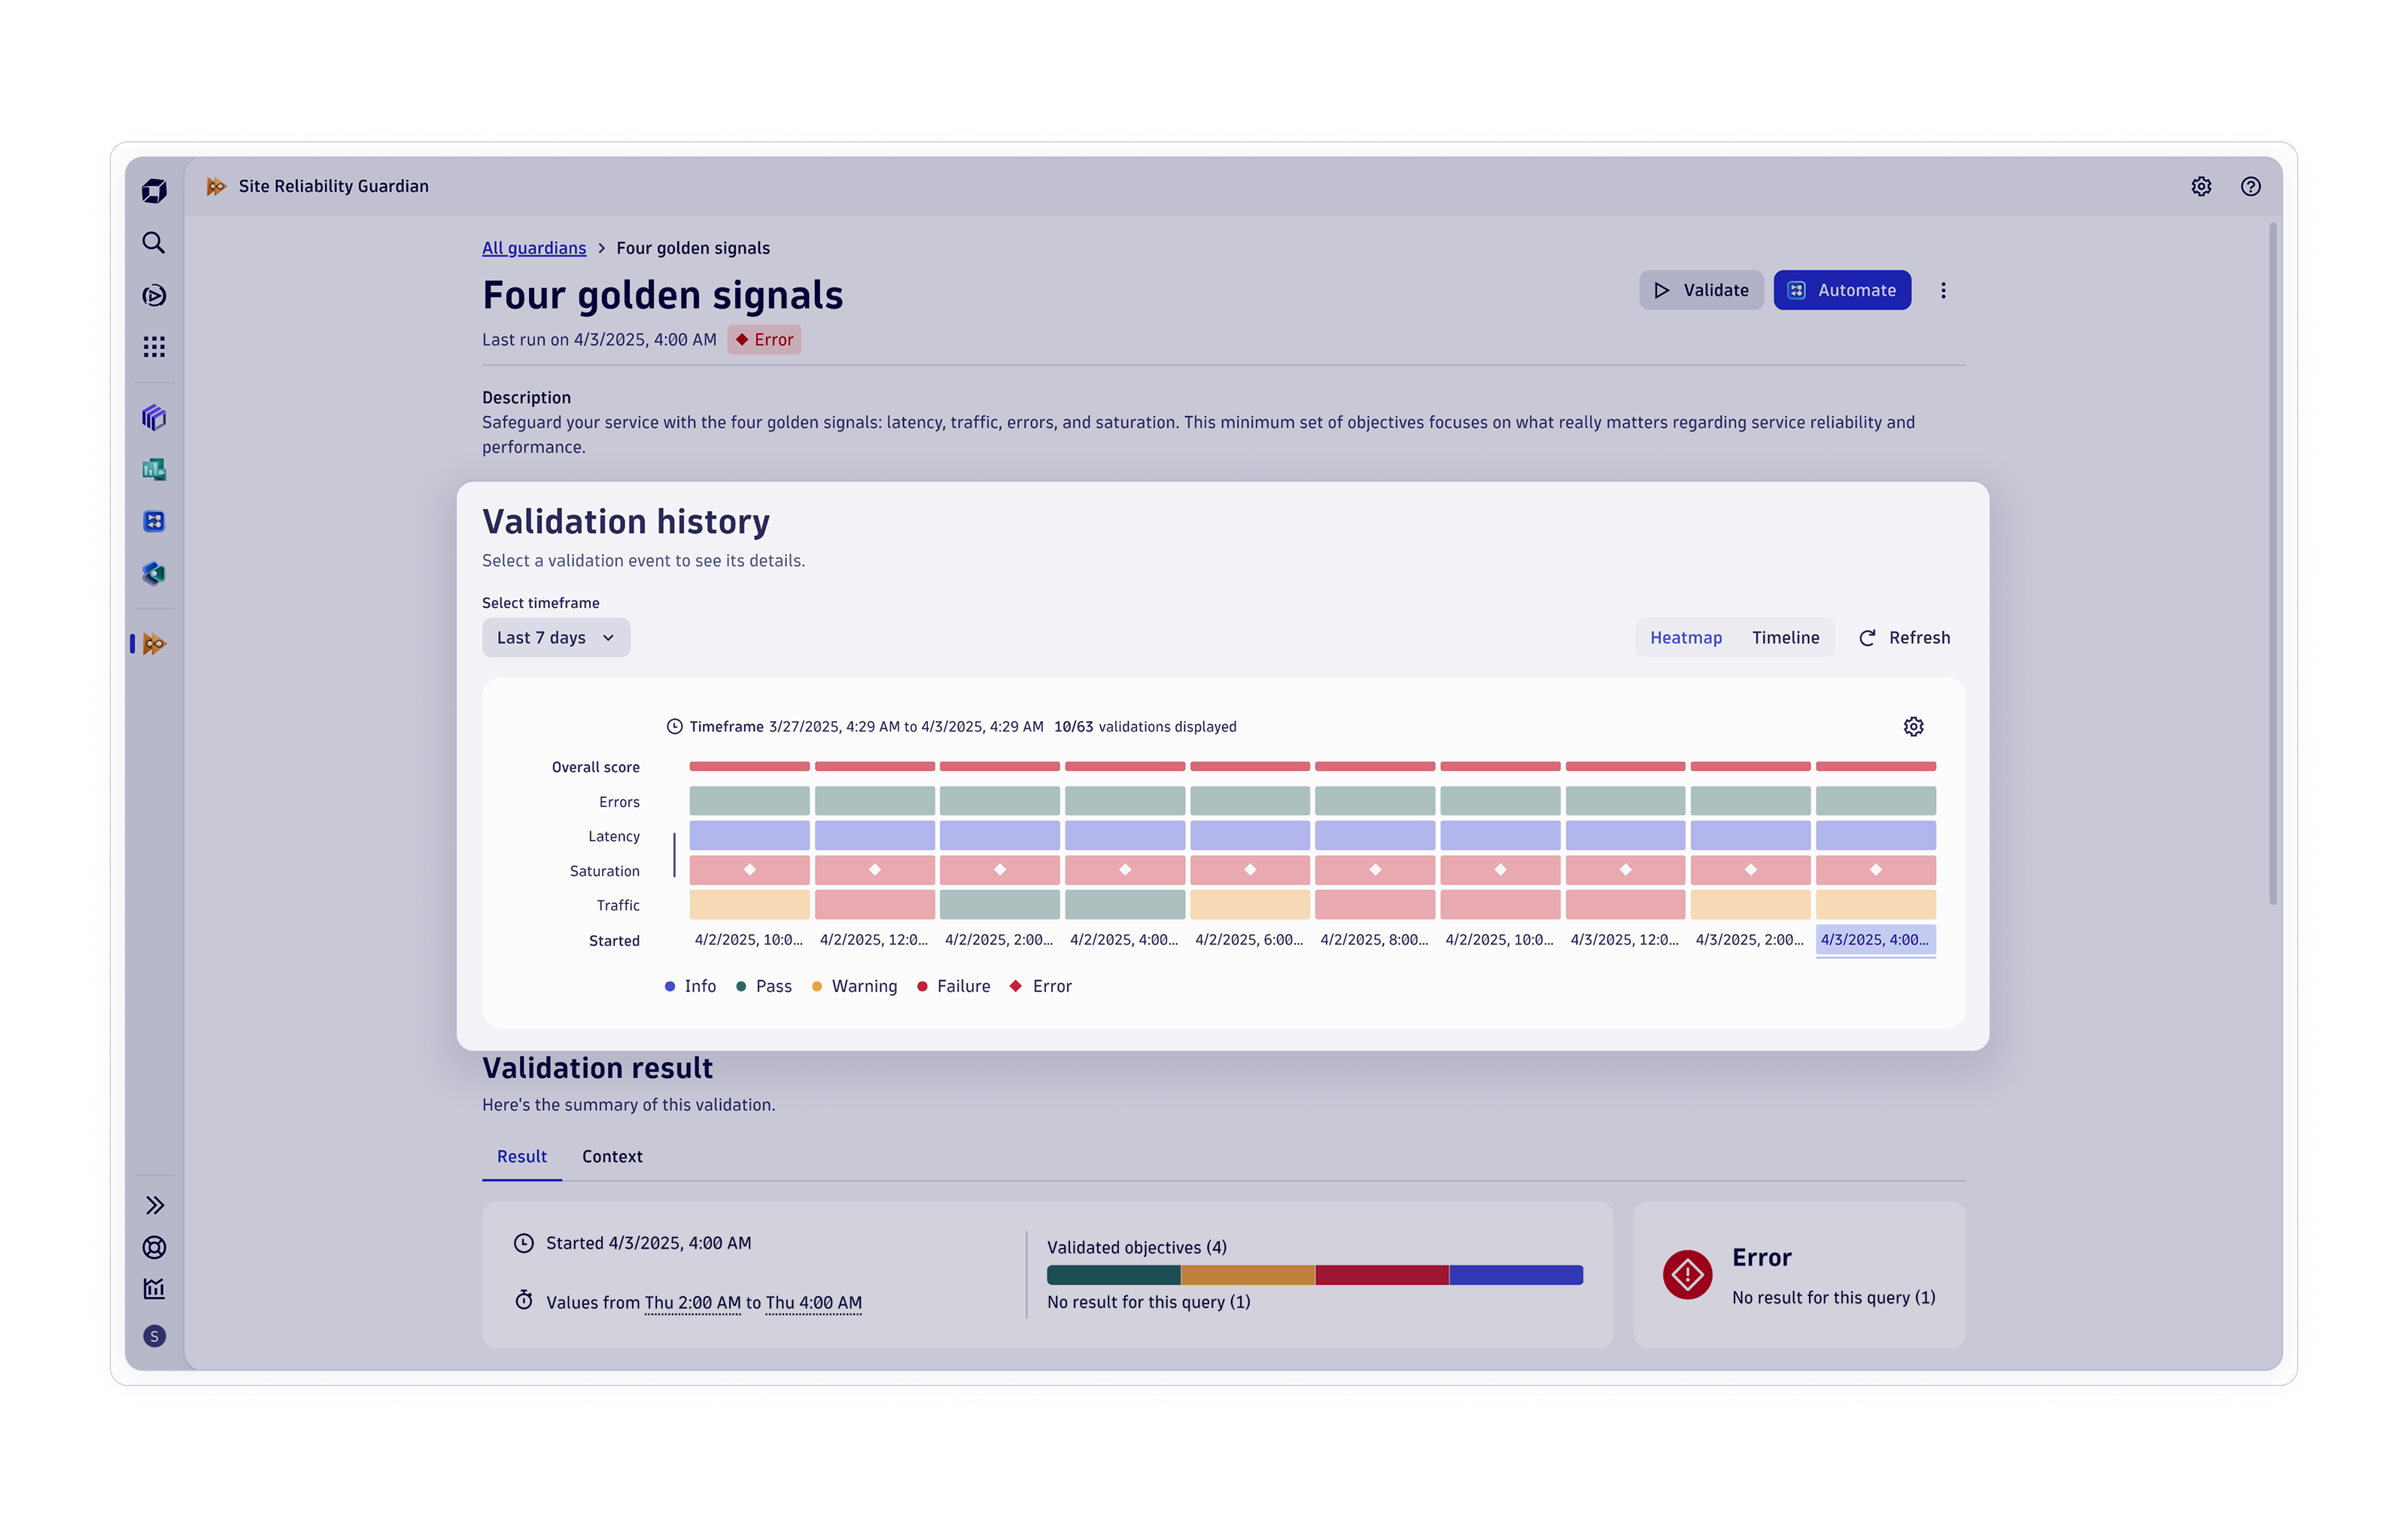
Softwarelieferung
-
Business-Analysen
Im Gartner® Magic Quadrant™ für Observability-Plattformen 2025 als Branchenführer ausgezeichnet
Lesen Sie im kostenfreien Report, warum Gartner uns im aktuellen Magic Quadrant in Bezug auf die „Ability to execute“ die Höchstbewertung gegeben hat.
This graphic was published by Gartner, Inc. as part of a larger research document and should be evaluated in the context of the entire document. The Gartner document is available upon request from Dynatrace. Dynatrace was recognized as Compuware from 2010-2014.
Für den Erfolg jedes Unternehmens entwickelt
Erfahren Sie, wie Kunden mit Dynatrace ihr Wachstum beschleunigen, Innovationen vorantreiben und ihren Kunden ein Erlebnis bieten, das sie überzeugt.


Über 715
unterstützte Technologien
Unsere Technologie ist offen und erweiterbar und mit allen gängigen Cloud-Plattformen und -Lösungen kompatibel.
Anerkannt von den renommiertesten Analysten der Branche
-
 Im Gartner® Magic Quadrant für Observability-Plattformen 2025 als Branchenführer ausgezeichnet
Mit Spitzenposition für „Ability to Execute“ -
 2025 ISG Provider Lens™
Im diesjährigen Forschungsbeitrag erfahren Sie, warum ISG Dynatrace bei cloud-nativer Observability insgesamt auf den besten Rang kürt. -
 The Forrester Wave™️: Report „Artificial Intelligence for IT Operations (AIOps)“
Lesen Sie nach, warum wir in den Kategorien für aktuelles Angebot und Strategie Bestnoten erreicht haben.